
Sold $CTL 6/21 10 puts @ .33. Stock printing a hammer after the post-earnings gap down (between 3 and 4 standard deviations on the daily bollinger bands–now hanging around the 2SD lower band). If assigned, dividend yield will be 10% so I will likely take the stock if it closes below 10 at June expiration.
Monthly Archives: May 2019
VXX long put spread
Again maybe a bit early, but on the chance that this vol spike has run its course, bought $VXX 5/31 32/27 bear put spread for 2.50 debit. 1:1 risk/reward. Breakeven in a little over 3 weeks is 29.50 with VXX currently trading at 30.76. Giving the trade a few weeks for vol to calm down in case I’m wrong. Will look to take 1.25-1.50 profit out of it.
Another UVXY call spread
Sold $UVXY 5/31 50/60 bear call spread @ 1.28
#shortstrangles AAPL
Sold June 21, 180/220 strangle for 2.65.
#earnings WYNN Z
WYNN Sold June 21, 110/155 strangle for 3.39.
Z Sold June 21, 35 straddle for 6.13. Thank you for the data Jeff.
Fading the ROKU move
I may be a bit early so I’ll have this on a short leash. Sold $ROKU 6/21 90/95 bear call spread @ 1.23.
AMZN June BuPS
Sold $AMZN 6/21 1815/1765 bull put spread @ 12.02. Delta of short strike 30. IV rank 39.
#earnings #closing GLW
January 28, sold an iron condor, was assigned short stock in Feb, sold some puts and then a long call hedge for this quarters earnings, paid a dividend, closed today somehow making 118 from after all the maneuverings.
A TRADE:
IRBT STO 5/10/19 96.0 CALLS @.85 Expires tomorrow. Added this to the short 95.0 calls
#earnings ROKU
Yesterday sold a June 21, 50/80 strangle. Today rolled the 50 put to 80 for a June 21 80 straddle. I’ve collected $1028 in premium.
TRADES:
NVTA BTO STOCK @18.47 A little, will add in small increments if opportunity is there.
IRBT STO 5/10/19 95.0 CALLS @1.11 Expires tomorrow.
Z earnings analysis
#Earnings $Z reports tonight. Below are details on earnings one-day moves over the last 12 quarters.
Feb. 21, 2019 AC +26.36% Biggest UP
Nov. 6, 2018 AC -26.92% Biggest DOWN
Aug. 6, 2018 AC -14.77%
May 7, 2018 AC -1.44%
Feb. 8, 2018 AC -2.67%
Nov. 7, 2017 AC +2.67%
Aug. 8, 2017 AC -9.05%
May 4, 2017 AC +9.29%
Feb. 7, 2017 AC -6.37%
Nov. 1, 2016 AC +6.32%
Aug. 4, 2016 AC -4.73%
May 3, 2016 AC +12.05%
Avg (+ or -) 10.22%
Bias -0.77%, small negative bias on earnings.
With stock at 34.00 the data suggests these ranges:
Based on current IV (expected move into Friday per TOS): 29.83 to 38.17
Based on AVERAGE move over last 12 quarters: 30.53 to 37.47
Based on MAXIMUM move over last 12 Q’s (26.9%): 24.85 to 43.14
Open to requests for other symbols.
YELP earnings analysis
#Earnings $YELP reports tonight. Below are details on earnings one-day moves over the last 12 quarters.
Feb. 13, 2019 AC -0.70%
Nov. 8, 2018 AC -26.59% Biggest DOWN
Aug. 8, 2018 AC +26.65%
May 10, 2018 AC -7.81%
Feb. 7, 2018 AC -14.04%
Nov. 1, 2017 AC -0.10%
Aug. 3, 2017 AC +27.66% Biggest UP
May 9, 2017 AC -18.35%
Feb. 9, 2017 AC -13.64%
Nov. 2, 2016 BO +9.94%
Aug. 9, 2016 AC +12.83%
May 5, 2016 AC +23.71%
Avg (+ or -) 15.17%
Bias 1.63%, small positive bias on earnings.
With stock at 39.60 the data suggests these ranges:
Based on current IV (expected move into Friday per TOS): 35.04 to 44.16
Based on AVERAGE move over last 12 quarters: 33.59 to 45.61
Based on MAXIMUM move over last 12 Q’s (27.7%): 28.65 to 50.55
Based on DOWN max only (-26.6%): 29.07
Open to requests for other symbols.
WYNN earnings analysis
#Earnings $WYNN reports tonight. Below are details on earnings one-day moves over the last 12 quarters.
Jan. 30, 2019 AC +2.09%
Nov. 7, 2018 AC -13.13% Biggest DOWN
Aug. 1, 2018 AC -6.53%
April 24, 2018 AC -3.74%
Jan. 22, 2018 BO +8.67% Biggest UP
Oct. 26, 2017 AC -1.50%
July 25, 2017 AC -5.02%
April 25, 2017 AC +5.89%
Jan. 26, 2017 AC +7.93%
Nov. 2, 2016 AC -9.31%
July 28, 2016 AC -6.41%
May 5, 2016 AC +1.77%
Avg (+ or -) 6.00%
Bias -1.61%, negative bias on earnings.
With stock at 132.00 the data suggests these ranges:
Based on current IV (expected move into Friday per TOS): 123.53 to 140.47
Based on AVERAGE move over last 12 quarters: 124.08 to 139.92
Based on MAXIMUM move over last 12 Q’s (13.1%): 114.67 to 149.33
Based on UP max only (8.7%): 143.44
Open to requests for other symbols.
ROKU
Slow down a little would you
TNDM Closed Puts / SPX Campaign / IRBT Calls / Roll NVTA Calls
#shortputs
$TNDM BTC 5/17 65 puts at 2.60. Have been rolling since 4/7. Total credit taken in 5.15.
#spxcampaign
$SPX BTC 5/10 2970/2985 BECS at .25. STO 5/2 at 3.35. Thank you @jeffcp66
#shortcalls
$IRBT STO 5/10 100 call at 1.30 Thank you @honkhonk81
$NVTA BTC 5/17 25 calls and STO 5/17 22.50 calls at .25 credit (covered) as stock dropped on earnings.
STMP’d out
$STMP tanking again… oh, to have been short!
SPX expires
#SPX1dte Expiring: $SPX May 8th 2780/2800/2930/2950 condors, sold yesterday for 1.05.
ROKU
STO IC May 10 80/83Calls 50/47 Puts $.27
WYNN earnings
TOS is confirming tomorrow after the close. These guys are always a guessing game until last minute.
TQQQ calls
#SyntheticCoveredCalls #LongLEAPs I’m still at it, selling weekly calls against my Jan 2020 66.67 long calls. I have been underwater and ITM on them for a few weeks, but the pullback allowed me to escape. I mistakenly forgot to close some ITM calls expiring Friday, so Monday’s gap down was super fortunate and allowed me to finally get above water.
Monday: Sold $TQQQ May 17th 68.5 calls for 1.26 (and covered short stock assigned Friday)
Today: Sold TQQQ May 24th 67.5 calls for 1.23
UVXY weekly call spread
Sold $UVXY 6/7 50/60 bear call spread @ 1.25 with UVXY currently at 40.65
#earnings #closing BUD
May 6, sold June 21, 80/95 strangle for 1.44, closed today for 1.04, agree with Jeff, not taking chances.
#earnings ROKU
Sold June 21, 50/80 strangle for 3.36, TastyTrade idea, thanks to Jeff for the data
A TRADE: Post is not timely.
IRBT BTO STOCK @98.14
STMP earnings analysis
#Earnings $STMP reports tonight. Below are details on earnings one-day moves over the last 12 quarters.
Feb. 21, 2019 AC -57.76% Biggest DOWN
Oct. 31, 2018 AC -9.74%
Aug. 1, 2018 AC +8.43%
May 3, 2018 AC +3.91%
Feb. 21, 2018 AC +11.00%
Nov. 2, 2017 AC -22.59%
Aug. 2, 2017 AC +35.88% Biggest UP
May 3, 2017 AC -0.40%
Feb. 23, 2017 AC -1.60%
Nov. 3, 2016 AC +6.63%
July 28, 2016 AC -6.22%
May 9, 2016 AC -5.32%
Avg (+ or -) 14.12%
Bias -3.15%, negative bias on earnings.
With stock at 84.00 the data suggests these ranges:
Based on current IV (expected move into Friday per TOS): 71.94 to 96.06
Based on AVERAGE move over last 12 quarters: 72.14 to 95.86
Based on MAXIMUM move over last 12 Q’s (57.8%): 35.48 to 132.52
Based on UP max only (35.9%): 114.14
Open to requests for other symbols.
REGN Jun
Looking for a bounce here. Sold $REGN 6/21 300 put @ 5.80. Delta 23.
EA strangle
Borrowing a Tasty Trade idea.
Sold $EA 6/21 85/110 strangle @ 2.16.
ROKU earnings analysis
#Earnings $ROKU reports tonight. Below are details on earnings one-day moves over the last 6 quarters, which accounts for its full history of earnings.
Feb. 21, 2019 AC +25.23%
Nov. 7, 2018 AC -22.29% Biggest DOWN
Aug. 8, 2018 AC +21.31%
May 9, 2018 AC -1.71%
Feb. 21, 2018 AC -17.71%
Nov. 8, 2017 AC +54.93% Biggest UP
Avg (+ or -) 23.86%
Bias 9.96%, positive bias on earnings.
With stock at 64.50 the data suggests these ranges:
Based on current IV (expected move into Friday per TOS): 55.66 to 73.34
Based on AVERAGE move over last 12 quarters: 49.11 to 79.89
Based on MAXIMUM move over last 12 Q’s (54.9%): 29.07 to 99.93
Based on DOWN max only (-22.3%): 50.12
Open to requests for other symbols.
#earnings #closing EA
Yesterday sold June 21, 75/110 strangle for 1.58, bought this morning for 1.10.
BUD closed
#Earnings Sold to close $BUD May10/May17 87.5 #DoubleCalendar for .55. Bought for .44 on Monday. It will be worth more if stock price continues to go higher, but not trusting the market to help.
Downside Warning
#VIXIndicator A Downside Warning is now in effect… look for continued drop, at least in the short term.
A TRADE:
IRBT BTO STOCK @98.45
IRBT STO 98.5 5/10/19 CALLS @2.10
#shortputs IRBT
Sold June 21, 80 put for 1.27, thanks honkhonk
TRADES:
IRBT BTO STOCK @97.79
IRBT STO 5/10/19 98.0 CALLS @2.00
#earnings #closing AMD
AMD April 30 sold June 21, 27 straddle for 4.55, bought today for 3.91. I could have done better earlier, worried about a bigger drop.
SPX extra
#SPX1dte An extra bearish trade since that seems to be the new black:
Sold $SPX May 17th (weeklys) 2960/2985 call spreads for 3.15.
#earnings TRIP MPC
TRIP sold June 21, 45/65 strangle for 1.15
MPC sold June 21, 50/65 strangle for 1.31
SPX 1-dte
#SPX1dte — nice to have some volatility again, allowing for wider condor.
Sold $SPX May 8th 2780/2800-2930/2950 condors for 1.05, IV: 20.7%, SPX 2873.
EA earnings analysis
#Earnings $EA reports tonight. Below are details on earnings one-day moves over the last 12 quarters.
Feb. 5, 2019 AC -13.30% Biggest DOWN
Oct. 30, 2018 AC -4.05%
July 26, 2018 AC -5.70%
May 8, 2018 AC +5.74%
Jan. 30, 2018 AC +6.95%
Oct. 31, 2017 AC -4.28%
July 27, 2017 AC +0.55%
May 9, 2017 AC +12.65%
Jan. 31, 2017 AC -0.51%
Nov. 1, 2016 AC +1.64%
Aug. 2, 2016 AC +2.40%
May 10, 2016 AC +13.69% Biggest UP
Avg (+ or -) 5.96%
Bias 1.32%, positive bias on earnings.
With stock at 92.50 the data suggests these ranges:
Based on current IV (expected move into Friday per TOS): 84.80 to 100.20
Based on AVERAGE move over last 12 quarters: 86.99 to 98.01
Based on MAXIMUM move over last 12 Q’s (13.7%): 79.84 to 105.16
Based on DOWN max only (-13.3%): 80.20
Open to requests for other symbols.
#earnings EA
I’m not afraid, sold June 21, 75/110 strangle for 1.58. As for WYNN, I am afraid.
FB BuPS
Sold $FB 6/21 180/170 bull put spread @ 1.71
#earnings #closing GILD
May 2, bought #doublecalendar in GILD for .37, May 10/17, sold today for .57.
TRADES: Last Friday was my…
TRADES: Last Friday was my best day of the year, Monday was my worst, be careful, risk management.
IRBT STO 4/10/17 ATM 101.0 CALLS @1.85 Covered
HIIQ STO 4/17/18 ATM 24.0 CALLS @1.90 Naked so far.
BA adding
Sold $BA 6/21 345/340 bull put spread @ 1.15
A TRADE:
IRBT BTO STOCK @ 100.50
A TRADE:
IRBT BTO STOCK A teeny bit @100.42
MMM put spread
Sold $MMM Jun 21 170/160 bull put spread @ 1.22. Delta of short strike 22.
TRADES:
YETI STO 5/10/19 30.5 CALLS @.90
YETI STO 510/19 30.5 PUTS @1.25 Straddle Risky May need adjusting.
SPX stopped
#SPX1dte Bought to close $SPX May 6th 2905/2885 put spreads for 1.85. Condors sold for .80 on low-volatility Friday.
Not a good morning to wake up to an ITM spread, but with such a large gap it seemed the move would be faded. Now it looks to have run out of steam, so not taking the chance of a collapse into the close.
#earnings BUD
Sold June 21, 80/95 strangle for 1.44, thanks Jeff
TRADES:
IRBT STO 5/10/19 105.0 CALLS @1.14
IRBT STC STOCK @100.80
BUD earnings trade and analysis
#Earnings $BUD reports tomorrow morning. Below are details on earnings one-day moves over the last 12 quarters.
Bought to Open BUD May10/May17 87.5 #DoubleCalendar for .42 & .44
Feb. 28, 2019 BO +4.60%
Oct. 25, 2018 BO -9.37% Biggest DOWN
July 26, 2018 BO -5.02%
May 9, 2018 BO -0.31%
March 1, 2018 BO +3.07%
Oct. 26, 2017 BO -0.94%
July 27, 2017 BO +6.16% Biggest UP
May 4, 2017 BO +5.68%
March 2, 2017 BO -3.72%
Oct. 28, 2016 BO -3.80%
July 29, 2016 BO +2.79%
May 4, 2016 BO -1.53%
Avg (+ or -) 3.92%
Bias -0.20%, no significant bias on earnings.
With stock at 87.50 the data suggests these ranges:
Based on current IV (expected move into Friday per TOS): 83.43 to 91.57
Based on AVERAGE move over last 12 quarters: 84.07 to 90.93
Based on MAXIMUM move over last 12 Q’s (9.4%): 79.30 to 95.70
Based on UP max only (+6.2%): 92.89
Open to requests for other symbols.
#shortstrangles DE
Sold June 21, 140/180 strangle for 1.93. DE is down around 6 points to 160 today on the tariff stuff
HTZ earnings analysis
#Earnings $HTZ reports tomorrow morning. Below are details on earnings one-day moves over the last 12 quarters.
Feb. 25, 2019 AC +4.04%
Nov. 8, 2018 AC +19.15%
Aug. 6, 2018 AC +24.63% Biggest UP
May 7, 2018 AC -18.72%
Feb. 27, 2018 AC -5.55%
Nov. 10, 2017 BO -2.24%
Aug. 8, 2017 AC +23.03%
May 8, 2017 AC -14.15%
Feb. 28, 2017 BO +13.59%
Nov. 7, 2016 AC -22.49% Biggest DOWN
Aug. 8, 2016 AC -4.96%
May 9, 2016 AC +0.22%
Avg (+ or -) 12.73%
Bias 1.38%, slight positive bias on earnings.
With stock at 19.75 the data suggests these ranges:
Based on current IV (expected move into Friday per TOS): 17.31 to 22.19
Based on AVERAGE move over last 4 quarters: 17.24 to 22.26
Based on MAXIMUM move over last 4 Q’s (24.6%): 14.89 to 24.61
Based on DOWN max only (-22.6%): 15.31
Open to requests for other symbols.
BA put spread
Sold $BA 6/21 350/340 bull put spread @ 1.98
UVXY call spreads
Sold:
$UVXY Jun 7 40/50 bear call spread @ 1.37
$UVXY Jun 14 40/50 bear call spread @ 1.39
UVXY
#DiagonalBearCallSpreads – Cautiously adding one here…
Sold UVXY MAY 31 2019 40.0 Call @ 2.30
REGN earnings analysis
#Earnings $REGN reports tomorrow morning. Below are details on earnings one-day moves over the last 12 quarters.
Feb. 6, 2019 BO -3.43%
Nov. 6, 2018 BO +0.75%
Aug. 2, 2018 BO +6.99% Biggest UP
May 3, 2018 BO -1.25%
Feb. 8, 2018 BO -3.58% Biggest DOWN
Nov. 8, 2017 BO +2.66%
Aug. 3, 2017 BO -2.03%
May 4, 2017 BO +6.70%
Feb. 9, 2017 BO +1.91%
Nov. 4, 2016 BO +1.60%
Aug. 4, 2016 BO -1.80%
May 5, 2016 BO +4.73%
Avg (+ or -) 3.12%
Bias 1.10%, positive bias on earnings.
With stock at 335.00 the data suggests these ranges:
Based on current IV (expected move into Friday per TOS): 315.64 to 354.36
Based on AVERAGE move over last 4 quarters: 325.52 to 346.48
Based on MAXIMUM move over last 4 Q’s (7.0%): 312.51 to 359.49
Based on DOWN max only (-3.6%): 323.97
Open to requests for other symbols.
VIX Indicator
#VIXIndicator, needless to say, the minor upside warning was canceled this morning with a $VIX high of 18.80 (we only needed 16.09). Any close at 16.09 or higher will mean a Downside Warning.
#hedge put on shortly after the futures open.
Appears tweets on tariffs are again driving volatility so to potentially take advantage of that set up /ES hedge.
STO the 89 DTE (July end of month/EOM) 2610 put and BTO 2605 puts in a 2:1 back ratio so long 2 2605 for every 2610 short. Each one will give about a 4-5k profit if we drop 10% and only cost $21.50 or $1075 total.
Hope I don’t need the lottery ticket and expect to lose on this but if we tank at least something will go up.
IRBT / GOOGL Adventure / SPX1DTE / LABU CVX Short Calls SFIX Expired / FB Assigned/ KNX SQ Short Puts
#bups
$IRBT BTC 5/3 98/102 BUPS for .20. STO at 1.35.
$IRBT STO 5/10 95/100 BUPS for 1.00
$IRBT STO 5/10 100105 BUPS for 2.05 You rock @honkhonk81
$GOOGL Misadventure
Assigned this morning stock $2000 (Yikes) Fortunately stock had a good day and I could close
the 5/3 1190/2000 BUPS at .50 per contract less than a total loss. Sold on 4/30
#spx1dte
$SPX 5/3 2850/2870/2945/2965 will show 90% of profit as market closed finally. Thank you @jeffcp66
#shortcalls
$CVX STO 5/10 119 call at .78. Sold against 5/17 long 125 calls. The 5/3 120 calls expired. Sold for 1.52. If this expires the losing trade (so far) of the long call will be reduced by 2.30. They were bought for $3. And another week possible.
$LABU BTC 5/3 50 call and STO 5/10 51 call at 1.45 added credit (Covered) Thank you @hcgdavis.
#optionsexpiration
$SFIX 28 call (covered)
#assignment
$FB 195 calls
#shortputs
$KNX STO 6/21 30 put at .80
$SQ STO 6/21 65 put at 1.82 Thank you @thomberg1201
Almost escaped
#SPX1dte SPX ended the day right on the line…. my 2945 short calls will likely settle with a debit of 19 to 50 dollars. Condors sold yesterday for .80.
IRBT Gained +5 this week….
IRBT Gained +5 this week. Ha, ha geewhiz, no the robots are not taking over………YET
GOOGL it
#Earnings #Rolling #revengetrade
Sold $GOOGL May 17th 1220/1210 put spreads for 7.75. Replacing my fully ITM spread of the same strikes expiring today.
#shortputs #closing IRBT
April 26, sold a post earnings, @honkhonk81 influenced 95 put for 2.10, bought today for .70
SPX 1-dte
#SPX1dte Sold to Open $SPX May 6th 2885/2905/2970/2985 condors for .80. (IV: 6.77%, SPX 2944)
Econ Calendar for week of 5/6/19
More yapping from Jerome Powell on Wednesday morning.
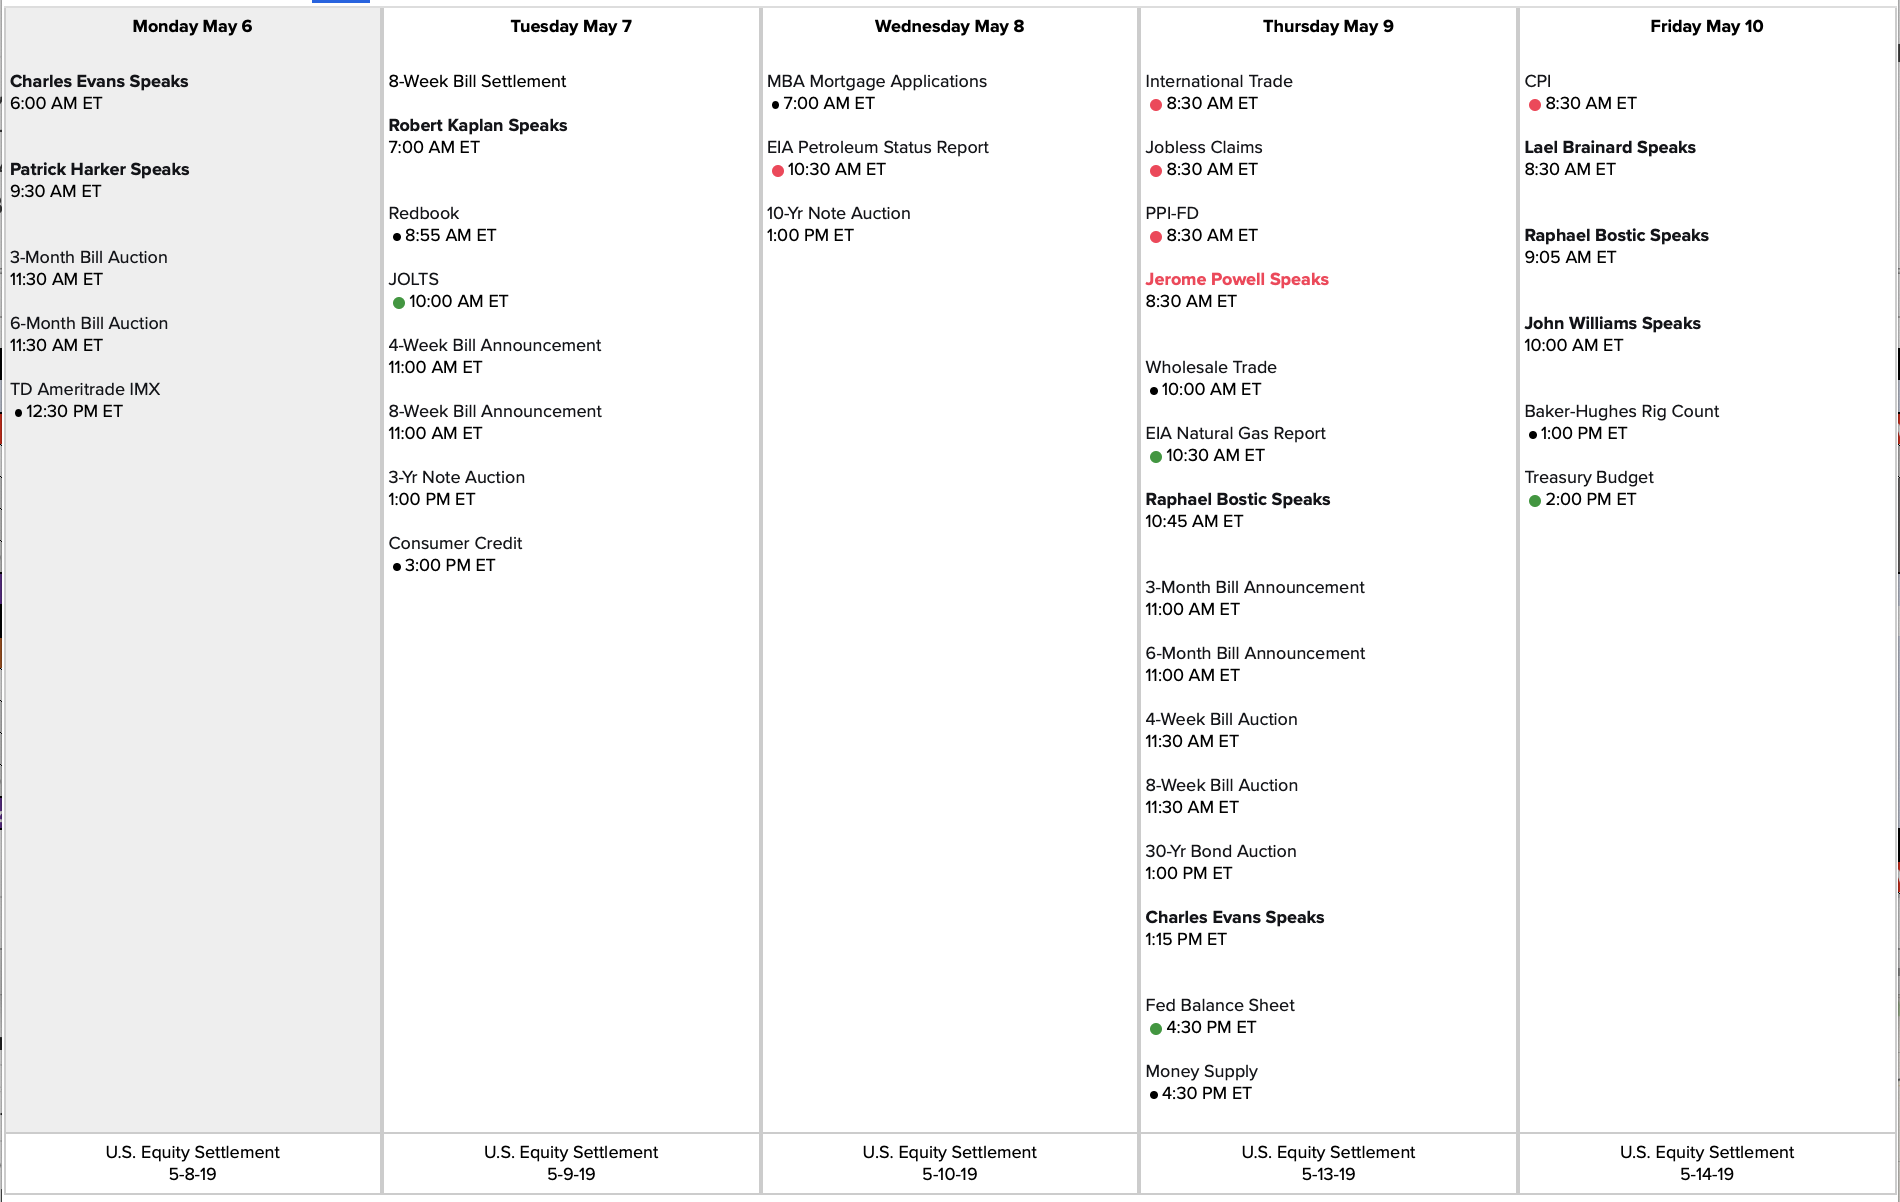

Link to calendar: https://us.econoday.com/byweek.asp?day=6&month=5&year=2019&cust=us&lid=0
A TRADE:
IRBT STO 5/10/19 109.0 CALLS @.85 Price now @104.72 1/3 of my position. Covered
#earnings #closing OLED
Yesterday sold a June 21, 110/210 strangle for 1.53, bought today for .85. Even with a 15 point move up, the short call became profitable.
CTSH
STO October 45 puts @.80 cents
TRADES:
IRBT STO 5/10/19 105/104 BuPS @.55
IRBT STO 5’10/19 103/100 BuPS @.1.02
TRADES:
IRBT STO 5/10/19 100/95 BuPS @.77 Margin Required $48 per contract, ridiculous. I could trade all day with only $1000 in my account.
SPX 7-dte
#SPX1dter – tempting fate, Sold $SPX May 10th 2970/2995 call spreads for 3.50.
Never mind
Volatility this week was too minor to disrupt upside warning. Yesterday’s VIX high was 4% shy of canceling the bullish signal, so apparently we are still full steam higher.
