
#spxcampaign
$SPX 4/30 2790/2810/2950/2970 Expired. STO on 4/15 at 3.90. Thank you @jeffcp66 Somehow, I lost track of this trade. Should have been closed out earlier. Whew!
Monthly Archives: April 2019
Using GOOGL To Find My Way / Sell CVX Call / Close Partial AAPL Call / Close NFLX Call / Rolling TNDM TQQQ Calls
#bullcallspreads
$GOOGL BTO 5/10 1200/1220 BUCS at 8.50
#bullputspreads
$GOOGL STO 5/3 1190/1200 BUPS at 4.50
$GOOGL STO 5/10 1165/1175 BUPS at 3.10
$GOOGL STO 6/21 1145/1160 BUPS at 4.50
May not find my way. Almost looks like I lost my mind.
#shortcalls
$CVX STO 5/3 120 call at 1.52. Sold against long 5/17 130 call position.
#longcalls Closing partial before earnings
$AAPL STC 5/17 175 call at 27.93. BTO at 9.47 on 3/11.
#coveredcalls
$NFLX BTC 5/3 385 call at .40. STO 4/23 for 6.89
Rolling
$TNDM BTC 5/3 64 calls and STO 5/17 70 calls for $1.00 debit. Earnings tonight. Not sure how smart this was. Will find out.
$TQQQ BTC 5/17 58 calls and STO 6/21 70 calls for $6.00 debit. These are sold against 1/2020 66.667 calls.
#earnings CLX
Sold June 21, 145/175 strangle for 1.50, thanks for the data Jeff.
A TRADE:
AMD STC STOCK @27.55 Earnings in 10 minutes.
CLX
Sold to open June 21, 145/175 strangle at 1.40
#earnings AMD
Kind of far out to be called an earnings trade, sold June 21, 27 straddle for 4.55
SPX 1-dte
#SPX1dte Sold to Open $SPX May 1st 2890/2910-2965/2980 condors for 1.10. (IV: 9.61%, SPX: 2942)
CLX dub cal
#Earnings Bought to open $CLX May03/May10 157.5 put calendars and 160 call calendars .74 total. So this is a split-strike #DoubleCalendar, a bit lower max profit but a wider profit range.
#earnings #doublecalendar FEYE
Bought double calendars for .12
WDC
BTC the June 37.5/62.5 strangle at .45 cents sod yesterday at 1.00
CLX earnings analysis
#Earnings $CLX reports tomorrow morning. Below are details on earnings one-day moves over the last 12 quarters.
Considering a #DoubleCalendar
Feb. 4, 2019 BO +5.68%
Oct. 31, 2018 BO -2.85%
Aug. 2, 2018 BO +6.17% Biggest UP
May 2, 2018 BO -0.70%
Feb. 2, 2018 BO -6.71% Biggest DOWN
Nov. 1, 2017 BO +1.17%
Aug. 3, 2017 BO +2.09%
May 3, 2017 BO +0.85%
Feb. 3, 2017 BO +4.07%
Nov. 2, 2016 BO -3.19%
Aug. 3, 2016 BO +0.99%
May 3, 2016 BO +1.94%
Avg (+ or -) 3.03%
Bias 0.79%, positive bias on earnings.
With stock at 158.50 the data suggests these ranges:
Based on current IV (expected move into Friday per TOS): 152.89 to 164.11
Based on AVERAGE move over last 4 quarters: 153.84 to 163.46
Based on MAXIMUM move over last 4 Q’s (6.7%): 148.00 to 169.30
Based on UP max only (+6.2%): 168.44
Open to requests for other symbols.
SPX stopped out
#SPX1dte BTC $SPX Apr 30th 2920/2900 put spreads for 1.95. Condors sold yesterday for .80.
TNDM earnings analysis
#Earnings $TNDM reports tonight. Below are details on earnings one-day moves over the last 12 quarters.
Pretty crazy stock. Topped out above 300 in 2009 and again in 2014, but was trading below 3.00 early last year.
Feb. 26, 2019 AC +25.19% Biggest UP
Nov. 1, 2018 AC -1.62%
July 30, 2018 AC +10.95%
April 26, 2018 AC -2.37%
March 1, 2018 AC +14.75%
Oct. 26, 2017 AC -6.25%
July 27, 2017 AC -10.16%
April 27, 2017 AC -9.52%
March 8, 2017 AC -11.62%
Nov. 1, 2016 AC -58.87% Biggest DOWN
July 28, 2016 AC -14.78%
April 28, 2016 AC +2.29%
Avg (+ or -) 14.03%
Bias -5.17%, negative bias on earnings.
With stock at 63.00 the data suggests these ranges:
Based on current IV (expected move into Friday per TOS): 55.47 to 70.53
Based on AVERAGE move over last 4 quarters: 54.16 to 71.84
Based on MAXIMUM move over last 4 Q’s (58.9%): 25.91 to 100.09
Based on UP max only (+25.2%): 78.87
Open to requests for other symbols.
#earnings AAPL
Sold May 17, 180/200 strangle for 1.40, thanks for the data Jeff.
SPX 1-dter BeCS spx 1…
SPX 1-dter BeCS spx 1 May 2019 2965/2970 at 0.25
SPOT off
#Earnings BTC $SPOT May 3rd 127/129-145/147 #IronCondor for .25. Sold Friday for .95
AAPL earnings analysis
#Earnings $AAPL reports tonight. Below are details on earnings one-day moves over the last 12 quarters.
Jan. 29, 2019 AC +6.83% Biggest UP
Nov. 1, 2018 AC -6.63% Biggest DOWN
July 31, 2018 AC +5.89%
May 1, 2018 AC +4.41%
Feb. 1, 2018 AC -4.33%
Nov. 2, 2017 AC +2.61%
Aug. 1, 2017 AC +4.72%
May 2, 2017 AC -0.30%
Jan. 31, 2017 AC +6.09%
Oct. 25, 2016 AC -2.24%
July 26, 2016 AC +6.49%
April 26, 2016 AC -6.25%
Avg (+ or -) 4.73%
Bias 1.44%, positive bias on earnings.
With stock at 202.00 the data suggests these ranges:
Based on current IV (expected move into Friday per TOS): 192.37 to 211.63
Based on AVERAGE move over last 4 quarters: 192.44 to 211.56
Based on MAXIMUM move over last 4 Q’s (6.8%): 188.20 to 215.80
Based on DOWN max only (-6.6%): 188.61
Open to requests for other symbols.
#earnings WDC
Yesterday sold June 21, 37.50/62.50 strangle for 1.00, bought this morning for .51.
GOOGL down
Alphabet is going to open with its biggest earnings move DOWN since January 2012.
Speculative trades
Small accounts, small size, IRAs. Don’t bet the farm on these types of trades.
#pietrades
LABU 5/3 49 put STO for 1.05
LABU 5/3 50 cc for cost basis of 48.30.
TQQQ 5/3 66 cc for cost of 65.03.
Will let call out, assign, or expire.
Hopefully the bottom does not fall out in 3-4 days, if so will roll as long as needed. All of these are 78.4% + annualized or better.
CC AAPL DOVA SFIX FB / Rolling BURL Calls
#coveredcalls
$AAPL STO 5/3 212.50 calls at 1.70
$DOVA STO 5/17 10 calls at .90
$SFIX STO 5/3 28 calls at .30
$FB STO 5/3 195 calls at 1.10
Rolling
$BURL BTC 5/3 165 call and STO 5/10 170 call for 3.40 debit. Stock currently at 171.35.
TRADE:
AMD STC STOCK @27.72 Earnings tomorrow, AMC.
SPX 1-dter
#SPX1dte We get an extra series this week, since the EOM (end-of-month) options expire on Tuesday.
Sold to Open $SPX Apr 30th 2900/2920-2970/2985 condors for .80. (IV: 8.73%, SPX: 2948)
SPX rolling
GOOGL condor
#Earnings Sold to Open $GOOGL May 3rd 1210/1220-1340/1350 #IronCondor for 2.15.
Closed SPX 4/29 Early
$SPX BTC 4/29 call side at .50. STO Friday at .90. I’ll let Put side expire. Thank you @jeff
Adding a put spread in SPOT
With the volume drying up, I added a bull put spread to the bear call spread I sold earlier this morning, to create an iron condor. Sold $SPOT 5/17 130/120 BuPS @ 1.50. Position is now 120/130/145/155 iron condor with total premium taken in around 1/3 the width of the strikes (3.23 for both sides). Short put strike at 26 delta.
MCD
Dbl Cal 05/03 05/10 190 – 200 $.63
A TRADE:
IRBT BTO STOCK @102.90 An addition.
IRBT BTO STOCK @103.40 ” ” “
NTES
#ShortPuts – Booking it…earnings the following week also.
Bought to Close NTES MAY 10 2019 250.0 Put @ .18 (sold for 3.80)
REGN SOXL T VIX
#ShortPuts #CoveredCalls – Been a busy couple weeks so finally catching up with some market stuff…
REGN: Stock assigned at 376.60 basis. Earnings next week so trying to sneak in a sale this week. Good timing for once sold right at the open. 🙂
Sold REGN MAY 03 2019 352.5 Call @ 2.45
SOXL: Last week sometime…
Sold SOXL JUN 21 2019 140.0 Put @ 5.40
T: Stock assigned at 31.02 basis…
Sold T MAY 24 2019 31.5 Calls @ .33
VIX: Theotrade style hedge. Selling put spreads to finance buying call spreads…
Sold VIX Jul 14/11 put spreads / Bought VIX Jul 19/25 call spreads @ .12 credit
#earnings THC, STX
Not much IV in the companies reporting tonight and tomorrow morning, but THC and STX are up there. Jeff, do you have data for them? Thank you as always.
A TRADE:
IRBT STO 5/3/19 105.0 CALL @1.29 Covered
A TRADE:
YETI STO 5/3/19 NTM 37.0 CALL @2.24 Will cover if necessary.
#earnings WDC
Sold June 21, 37.50/62.50 strangle for 1.00. Thanks you Jeff for the data.
A TRADE:
IRBT STO 5/3/19 102/98 BuPS @1.32
WDC earnings analysis
#Earnings $WDC reports tonight. Below are details on earnings one-day moves over the last 12 quarters.
Jan. 24, 2019 AC +7.52% Biggest UP
Oct. 25, 2018 AC -18.18% Biggest DOWN
July 26, 2018 AC -7.73%
April 26, 2018 AC -7.99%
Jan. 25, 2018 AC +1.82%
Oct. 26, 2017 AC -2.53%
July 27, 2017 AC -7.54%
April 27, 2017 AC +3.92%
Jan. 25, 2017 AC -1.93%
Oct. 26, 2016 AC +5.41%
July 28, 2016 AC -11.52%
April 28, 2016 AC -11.28%
Avg (+ or -) 7.28%
Bias -4.17%, negative bias on earnings.
The FIVE-day outlook is more bearish, with a downside max of -23%.
With stock at 51.00 the data suggests these ranges:
Based on current IV (expected move into Friday per TOS): 46.50 to 55.50
Based on AVERAGE move over last 4 quarters: 47.29 to 54.71
Based on MAXIMUM move over last 4 Q’s (18.2%): 41.73 to 60.27
Based on UP max only (7.5%): 54.84
Open to requests for other symbols.
A TRADE:
IRBT BTO STOCK @101.65
SPOT post-earnings
$SPOT did not hold this morning’s post-earnings gap and is now trading down on the day. Sold 5/17 145/155 bear call spread @ 1.73.
SPX 1-dte
#SPX1dte Since I closed today’s call spread on Friday, I moved it up 5-points and sold one again:
Sold $SPX Apr 29th 2955/2965 call spreads for .75.
GOOGL earnings analysis
#Earnings $GOOGL reports tonight. Below are details on earnings one-day moves over the last 12 quarters.
Feb. 4, 2019 AC +0.91%
Oct. 25, 2018 AC -1.79%
July 23, 2018 AC +3.89%
April 23, 2018 AC -4.76%
Feb. 1, 2018 AC -5.28% Biggest DOWN
Oct. 26, 2017 AC +4.26% Biggest UP
July 24, 2017 AC -2.93%
April 27, 2017 AC +3.71%
Jan. 26, 2017 AC -1.39%
Oct. 27, 2016 AC +0.27%
July 28, 2016 AC +3.32%
April 21, 2016 AC -5.41%
Avg (+ or -) 3.16%
Bias -0.43%, negative bias on earnings.
The FIVE-day outlook is more bearish, with a downside max of -8%.
With stock at 1,275.00 the data suggests these ranges:
Based on current IV (expected move into Friday per TOS): 1,227.78 TO 1,322.22
Based on AVERAGE move over last 4 quarters: 1,234.71 TO 1,315.29
Based on MAXIMUM move over last 4 Q’s (5.4%): 1,206.02 TO 1,343.98
Based on UP max only (4.3%): 1,329.32
Open to requests for other symbols.
AMD Hi geewhiz, I was…
AMD Hi geewhiz, I was assigned too, but I also had a bushel of covered calls that expired, and I still have the stock, except now I have a little more? ;>) I’ll be out of the stock before earnings, which are Tuesday. I’ll get out of them tomorrow, Monday, which will give me more gunpowder to trade my new fav, IRBT. I already own some stock and a few BuPS, premiums are good, and uses very little margin, IMO anyway.
Have a great week. Honkhonk81
AMD Assigned
#assignment
$AMD 28 put Basis 27.43 Stock at 27.88 Thank you @honkhonk81
Expirations / Closed SPX Early / 1 DTE SPX / Assigned XLNX / STO NFLX TSLA BUPS
#optionsexpiration
$FB 195 calls (covered)
#spxcampaign
$SPX BTC 4/26 2930/2955 BECS at 1.40 STO 4/22 at 3.17 The put side sold for 1.63 and expired. Thank you @jeffcp66
#spx1dte
$SPX STO 4/29 2875/2895/2950/2965 IC at 1.30 Thank you @jeffcp66
#earnings
$XLNX Assigned at 128. STO 4/26 128 put at 2.30 before earnings. Stock now at 118.93. Will cover.
#shortputs
$NFLX STO 5/17 350/355 BUPS at 1.35
$TSLA STO 5/17 245/250 BUPS at 1.95 Hope I was early, not wrong.
A TRADE:
IRBT BTO STOCK @99.75 Added
Taking a loss on NDX iron condor
For today’s expiration. Letting the put spread expire. Watching for a move down into the close to get a better price on on the call spread side.
#earnings #inversion #closing EA
Feb. 5, I sold an 80/100 earnings strangle. Through rolling and going inverted, and rolling some more, I closed a May 3, 90/105 inverted strangle today and made $10.55 after trading costs. EA went way down, then way up, classic whip saw. If I would have done nothing, I may have been OK, but I’m taking the $10 and going to happy hour to plan trading the next earnings on May 7.
SBUX closed
#Earnings Closed last batch for .95
SPX 1-dte
#SPX1dte Sold to Open $SPX Apr 29th 2875/2895-2950/2965 condors for 1.35. (IV: 6.89%, SPX 2929)
Econ Calendar for week of 4/29/19
#Jobs report is Friday at 8:30am ET
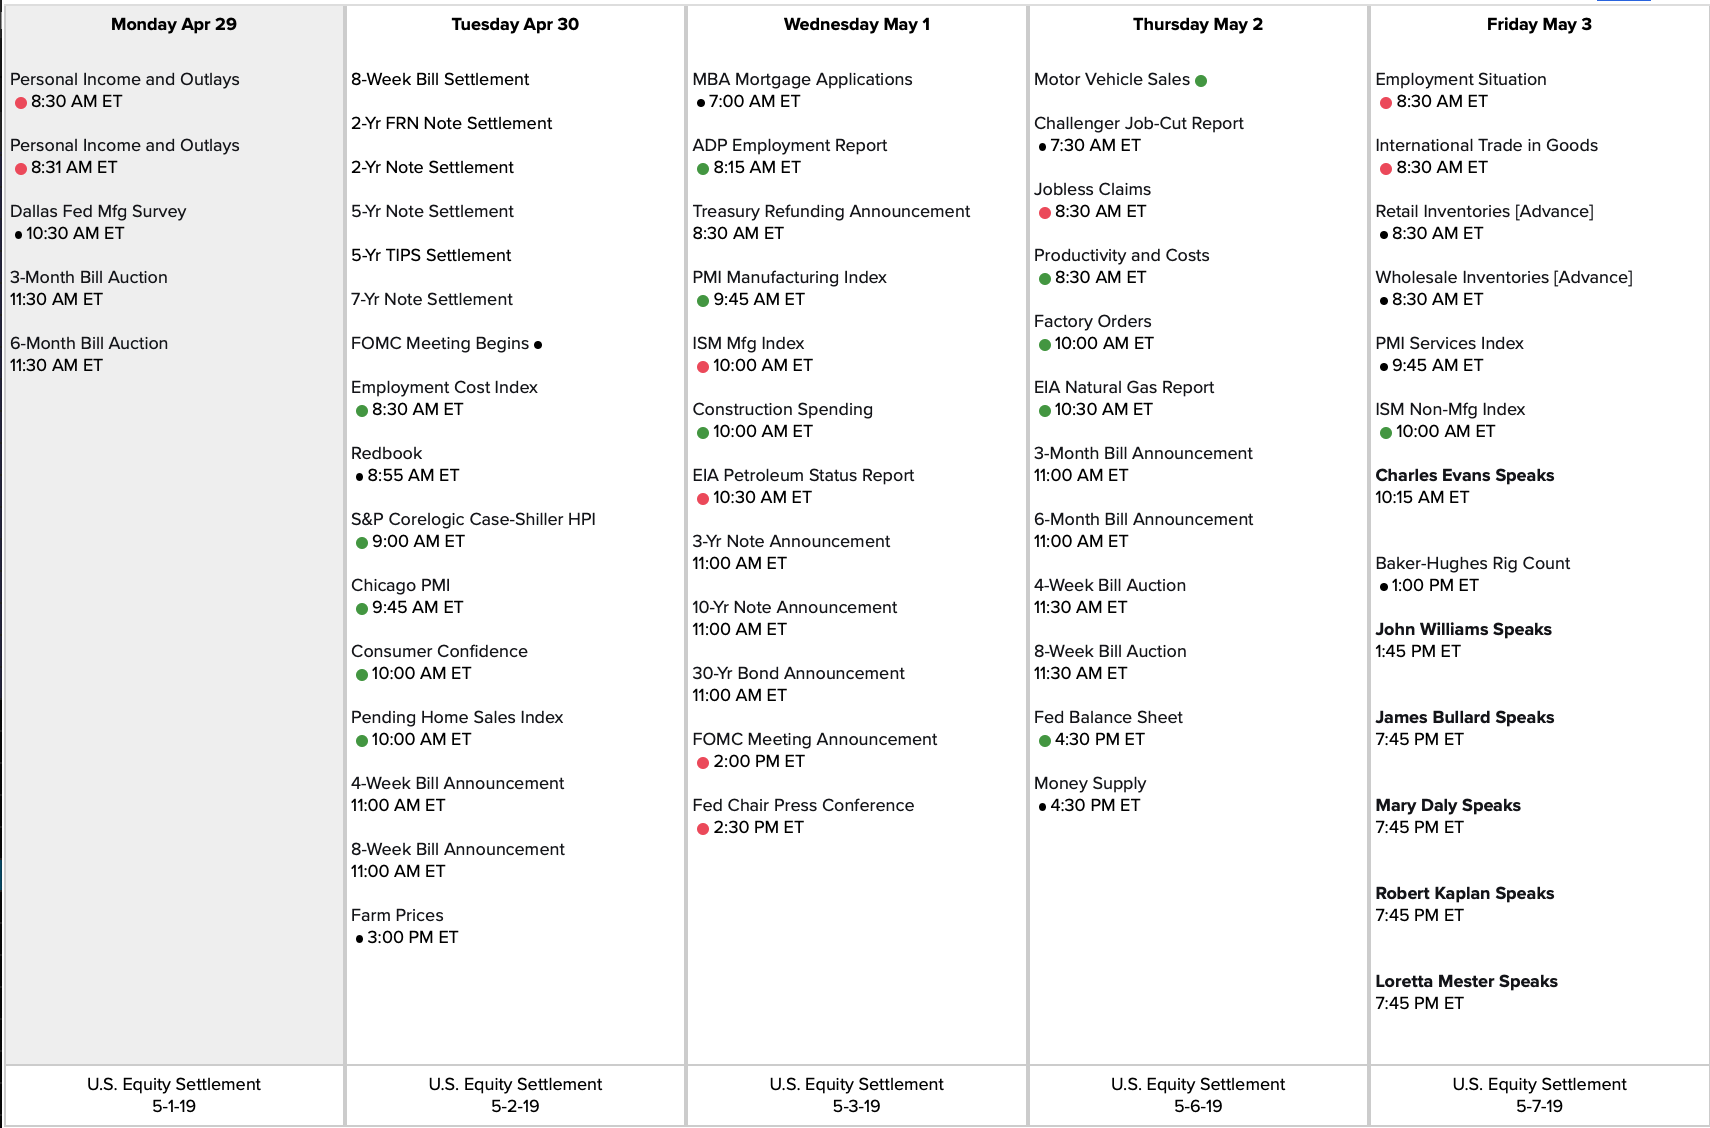

Link to calendar: https://us.econoday.com/byweek.asp?day=29&month=4&year=2019&cust=us&lid=0
SPOT condor
#Earnings Sold to Open $SPOT May 3rd 127/129-145/147 #IronCondor for .96 and .95.
Strikes outside stock’s previous max moves, and risk/reward is just shy of 1:1.
AMZN half closed
#Earnings Bought to close half of my position, $AMZN Apr 26th 1885/1915/1945 #IronButterfly for 13.22. Sold yesterday for 28.15. Getting a bit nervous about this uptrend… I want to give it more chance to come back to 1915, but locking in nice profit on this first batch now in case it keeps going.
A TRADE:
IRBT BTO STOCK 99.79
#shortputs HOG
Sold May 17, 36 put for .59 HOG is just under 37, seems to have bottomed at 36.
Moth to the flame TRADE:
IRBT STO 5/3/19 BuPS 98.5/95.5 PUTS @.97
SBUX half closed
#Earnings Sold to close half of my position, $SBUX Apr26/May03 77 #DoubleCalendar for .85. Bought yesterday for .30. Waiting on the other half as this may be close to a pin. Same with $AMZN.
NDX IC for today
Another TastyTrade idea.
Sold 4/26 7710/7730/7800/7820 iron condor for 5.36.
#shortstrangles TSLA
TastyTrade idea, sold June 21, 160/325 strangle for 3.58
SPOT earnings analysis
#Earnings I usually don’t take trades on Monday morning earnings, but this stock has excellent premium and thus far, modest moves. However, its history is short so it could surprise us. That is reflected in the expected move, which is much higher than its historical average move.
Looking at a condor, with wings 2-points wide.
$SPOT reports Monday morning. Below are details on earnings one-day moves over its entire history.
Feb. 6, 2019 BO -2.83%
Nov. 1, 2018 BO -5.69% Biggest DOWN
July 26, 2018 BO +4.40% Biggest UP
May 2, 2018 AC -5.65%
Avg (+ or -) 4.64%
Bias -2.44%, negative bias on earnings.
With stock at 137.00 the data suggests these ranges:
Based on current IV (expected move into Friday per TOS): 125.96 to 148.04
Based on AVERAGE move over last 4 quarters: 130.64 to 143.36
Based on MAXIMUM move over last 4 Q’s (5.7%): 129.20 to 144.80
Based on UP max only (4.4%): 143.03
Open to requests for other symbols.
#earnings #closing GRUB
Yesterday sold 50/90 strangle for 1.41, bought this morning for .47.
IRBT roll
Rolled $IRBT 90/100 4/26/2019 #BUPS to 5/10/2019 $1 credit.
Profits in the end
Was able to turn $NOC double calendar into a profitable trade by taking assignment and then legging out. Sold the long puts for 16.00 at the open, then closed stock for 280.50.
And on one account that I hadn’t noticed was still open last night on $MMM, did the same thing… sold long puts for 30.00 and covered stock for 191.00, netting 1.00 on the close and a tiny profit on the trade. Better than a loss! And for once, I played the swings right… usually a weakness for me.
LULU BeCS
BTC LULU 180/190 4/26 BeCS @0.27.
This was some “when in doubt close it out” — it was the call side of an 150/160/180/190 4/26 #ironcondor sold for 1.25 on 4/17. Still have the put side – didn’t get any fills for a BTC order – expecting to hold it through expiration.
FFIV closed
#Earnings Sold to Close $FFIV Apr26/Mar03 165 #DoubleCalendar for 2.10. Bought yesterday for .81 and .82.
Had to pay .02 to close the $MMM 220 put calendar to avoid assignment. Dub Cal bought yesterday for .904
AMZN IB
#Earnings Sold to Open $AMZN Apr 26th 1885/1915/1945 #IronButterfly for 28.15. Risking 1.85 to make hopefully a lot.
#fallingknife possibilities HOG NTGR
Both of these down big after earnings
TSLA combo trade.
BTO June 250 call @ 21.57
STO June 200 puts @ 6.06
STO June 270 call @ 10.78
The stock is breaking down on volume and the next major support level is 180
#earnings GRUB
Sold May 17, 50/90 strangle for 1.41 stock at 70, thank you for the data Jeff.
#ironcondor TSLA
Sold May 17, 210/215/285/290 for 1.06.
SPX 1-dte
#SPX1dte Sold to Open $SPX Apr 26th 2875/2895-2950/2970 condors for 1.00. (IV: 9.36%, SPX: 2929)
A TRADE:
IRBT STO 5/3/19 101/98 BuPS @1.35 I think the stock will go up 1 point by next Friday, after being down over 30 points yesterday.
SBUX Dub Cal
#Earnings Bought to Open $SBUX Apr26/May03 77 #DoubleCalendar for .30. Partial fill so far. This is a cheap play, must stay within its average range, or at least drift through it tomorrow. I placed a double-sized because of the low cost.
It is the tightest Bid/Ask I have seen on a double calendar, so very liquid.
Dub cal updates
#Earnings
#EarlyAssignment last night on just one (1) $NOC Apr 26th 295 put, part of my #DoubleCalendar. Sold the long May 2nd put for 16.00, and waited through the dip to sell stock for 280.50, netting 1.50 for a profit of .43. The rest of my position will probably not fare so well, but I’ll probably hold again tonight and may be assigned more. (Dub cal bought Wednesday for 1.07.
$MMM has made its biggest earnings drop in at least 17 years, which is as far back as I have records. Nothing you can do about that…. it was the perfect candidate for this strategy, but even “perfect” is no guarantee. I will likely close put side today and not risk early assignment. (bought yesterday for .91)
$FFIV jumped around the center strike in the morning but I got no fill. Now looking for it to recover. (bought yesterday for .81)
Not seeing any great candidates for dub cals today. Maybe $SBUX. Looking at a low risk #IronButterfly on $AMZN.
SBUX earnings analysis
#Earnings $SBUX reports tonight. Below are details on earnings one-day moves over the last 12 quarters.
Jan. 24, 2019 AC +3.62%
Nov. 1, 2018 AC +9.70% Biggest UP
July 26, 2018 AC +1.36%
April 26, 2018 AC -1.71%
Jan. 25, 2018 AC -4.22%
Nov. 2, 2017 AC +2.11%
July 27, 2017 AC -9.24% Biggest DOWN
April 27, 2017 AC -2.02%
Jan. 26, 2017 AC -4.00%
Nov. 3, 2016 AC +1.89%
July 21, 2016 AC +0.52%
April 21, 2016 AC -4.88%
Avg (+ or -) 3.77%
Bias -0.57%, Slight negative bias on earnings.
With stock at 76.75 the data suggests these ranges:
Based on current IV (expected move into Friday per TOS): 73.74 to 79.76
Based on AVERAGE move over last 12 quarters: 73.85 to 79.65
Based on MAXIMUM move over last 12 Q’s (9.7%): 69.31 to 84.19
Based on DOWN max only (-9.2%): 69.66
Open to requests for other symbols.
GRUB earnings analysis
#Earnings $GRUB reports tonight. Below are details on earnings one-day moves over the last 12 quarters.
Feb. 7, 2019 BO -2.00%
Oct. 25, 2018 BO -11.98%
July 25, 2018 BO +23.53%
May 1, 2018 BO -8.39%
Feb. 8, 2018 BO +27.36% Biggest UP
Oct. 25, 2017 BO +11.17%
Aug. 3, 2017 AC +9.05%
April 27, 2017 BO +22.55%
Feb. 8, 2017 BO -3.51%
Oct. 26, 2016 BO -12.69% Biggest DOWN
July 28, 2016 BO +24.10%
May 3, 2016 BO -7.12%
Avg (+ or -) 13.62%
Bias 6.01%, positive bias on earnings.
With stock at 70.00 the data suggests these ranges:
Based on current IV (expected move into Friday per TOS): 60.14 to 79.86
Based on AVERAGE move over last 12 quarters: 60.47 to 79.53
Based on MAXIMUM move over last 12 Q’s (27.4%): 50.85 to 89.15
Based on DOWN max only (-12.7%): 61.12
Open to requests for other symbols.
