
#Earnings . Sold to close $SWKS Nov15/Nov22 101 #DoubleCalendar for 1.40. Bought yesterday for .732.
Only partial fill so far.
Monthly Archives: November 2019
WMT earnings analysis
#Earnings $WMT reports tomorrow morning. Below are details on earnings one-day moves over the last 12 quarters.
Aug. 15, 2019 BO +6.22%
May 16, 2019 BO +1.43%
Feb. 19, 2019 BO +2.21%
Nov. 15, 2018 BO -1.96%
Aug. 16, 2018 BO +9.33%
May 17, 2018 BO -1.90%
Feb. 20, 2018 BO -10.17% Biggest DOWN
Nov. 16, 2017 BO +10.89% Biggest UP
Aug. 17, 2017 BO -1.58%
May 18, 2017 BO +3.22%
Feb. 21, 2017 BO +2.99%
Nov. 17, 2016 BO -3.08%
Avg (+ or -) 4.58%
Bias 1.47%, positive bias on earnings.
With stock at 120.00 the data suggests these ranges:
Based on current IV (expected move into Friday per TOS): 115.34 to 124.66
Based on AVERAGE one-day move over last 12 quarters: 114.50 to 125.50
ased on MAXIMUM one-day move over last 12 Q’s (10.9%): 106.93 to 133.07
Based on DOWN max only (-10.2%): 107.80
Open to requests for other symbols.
UVXY
#ShortCalls #BearCallSpreads – Taking advantage of the massive volatility pop this morning….
Sold UVXY NOV 29 2019 20.0 Calls @ .70
Sold UVXY JAN 17 2020 24.0/34.0 Bear Call Spreads @ .90
#assignment #coveredcalls UBER I was…
#assignment #coveredcalls UBER
I was assigned 100 shares of UBER on a Dec. 36 put, first sold Aug. 9 and rolled 3 times.
Sold a Nov. 22, 27.50 call for .40, cost basis is 33.53. I guess I’ll stop using LYFT.
NTAP earnings analysis
#Earnings $NTAP reports tonight. Below are details on earnings one-day moves over the last 12 quarters.
Aug. 14, 2019 AC +3.93%
May 22, 2019 AC -8.10%
Feb. 13, 2019 AC -5.47%
Nov. 14, 2018 AC -11.72% Biggest DOWN
Aug. 15, 2018 AC -3.58%
May 23, 2018 AC +1.93%
Feb. 14, 2018 AC -4.89%
Nov. 15, 2017 AC +15.91% Biggest UP
Aug. 16, 2017 AC -6.72%
May 24, 2017 AC +3.53%
Feb. 15, 2017 AC +4.18%
Nov. 16, 2016 AC +6.24%
Avg (+ or -) 6.35%
Bias -0.40%, slight negative bias on earnings.
With stock at 60.50 the data suggests these ranges:
Based on current IV (expected move into Friday per TOS): 55.03 to 65.97
Based on AVERAGE one-day move over last 12 quarters: 56.66 to 64.34
ased on MAXIMUM one-day move over last 12 Q’s (15.9%): 50.87 to 70.13
Based on DOWN max only (-11.7%): 53.41
Open to requests for other symbols.
TWTR NUGT Puts Rolled / LABU Covered Calls / ZM CC Rolled / GLOB Put Closed
#shortputs
$TWTR BTC 11/15 32 put and STO 11/22 32 put at even. Getting time but not paying for it.
$NUGT BTC 11/15 36 put and STO 12/13 36 put at .25 credit. Getting time and getting paid.
#coveredcalls
$LABU STO 12/20 45 calls at 1.65
$ZM BTC 11/15 68.50 calls and STO 11/29 for added .35 credit. Stock at 68.03.
#shortputs
$GLOB BTC 11/15 90 put at .40. STO 10/14 at 2.80. Thank you @ramie77
SPX 1 dte
#SPX1dte Sod to Open $SPX Nov 13th 3050/3060-3110/3120 condors for .50. Ten-wide, double position.
IV 7.61%, SPX 3088.
VIX hedge
#Hedge I’m calling it a hedge, but I’m not net long or short so it’s really just a trade.
Bought to open $VIX Jan 21st 17/20 call spread for .80
SWKS Dub Cal
#Earnings Bought to open $SWKS Nov15/Nov22 101 #DoubleCalendar for 0.732 (avg price).
More VXX closed
#VXXGame Sold to close next batch of $VXX Jan 2020 long 20 puts for 3.25. Bought for avg price of 1.30. Still holding more.
SPX 4-dte closed
#SPX1dte Bought to close $SPX Nov 15th 3050/3025 put spreads for 1.35. Sold yesterday for 1.75. I’m not liking the look of today’s action, so not going to let this get worse.
PLMR
STO January 45 puts at 3.50
TNA WYNN
#LongStock – Here’s my excitement for the day….
TNA: Sold 1 share @ 64.10
WYNN: Sold 1 share @ 122.54
Oddball shares sitting from old dividends before I changed my divvy payout preference to cash. 🙂 🙂 🙂
Closing ROKU
Bought to close $ROKU 12/20 105/95 bull put spread @ .75. Sold for 1.78 on 11/8.
TQQQ long LEAPs closed
#LongLEAPs Sold to Close $TQQQ Jan 2020 66.67 long calls for 11.05.
Starting buying on Oct 4th, 2018, LAST year, for average price of 10.12 over 5 accounts.
I reduced cost basis by selling covered calls (and sometimes puts), but I’m behind on bookkeeping so not sure by how much yet. It looks like I reduced it by only a little on some accounts, up to about a half on others. I’ve decided to close now as I do not trust the market for remainder of year. I do think higher is certainly possible, but that we could also see a pullback soon that would not regain current levels until after expiration.
EWZ
#ShortPuts – A little starter position on the pullback to the 200ma. I’ll add if it doesn’t hold here…
Sold EWZ DEC 20 2019 40.0 Puts @ .74
DIS/NFLX
I am buying an arbitrage.
BTO December 140 calls on DIS and Buying the same dollar amount of 290 puts On NFLX
SWKS earnings analysis
#Earnings $SWKS reports tonight. Below are details on earnings one-day moves over the last 12 quarters.
Aug. 7, 2019 AC +0.46%
May 2, 2019 AC -3.51%
Feb. 5, 2019 AC +11.49%
Nov. 8, 2018 AC -8.08% Biggest DOWN
July 19, 2018 AC -5.35%
May 3, 2018 AC +4.28%
Feb. 5, 2018 AC +10.44%
Nov. 6, 2017 AC -4.41%
July 20, 2017 AC -0.15%
April 27, 2017 AC -4.28%
Jan. 19, 2017 AC +13.01% Biggest UP
Nov. 3, 2016 AC +0.53%
Avg (+ or -) 5.50%
Bias 1.20%, positive bias on earnings.
With stock at 102.00 the data suggests these ranges:
Based on current IV (expected move into Friday per TOS): 95.27 to 108.73
Based on AVERAGE one-day move over last 12 quarters: 96.39 to 107.61
ased on MAXIMUM one-day move over last 12 Q’s (13.0%): 88.73 to 115.27
Based on DOWN max only (-8.1%): 93.76
Open to requests for other symbols.
SPX 4-dte
#SPX1dte Sold to Open $SPX Nov 15th 3050/3025 put spreads for 1.75, IV 9.37%, SPX close 3087
Sold this after the bell. I was wrong about a rally today but still think we have higher to go before this peters out.
Expiring today: 3065/3046 put credit spread and 3110/3125 call debit spread, trades placed Friday for net credit of .40.
#earnings #closing ROKU and another…
AAPL BUPS
$AAPL STO 12/20 240/250 BUPS at 1.30
@smasty Sue, what is your…
@smasty
Sue, what is your plan for TGT #suecollar trade?
With the earning coming up, puts are very expensive.
#earnings #closing DIS Finally able…
#spycraft Starter position this morning….
Starter position this morning.
STO the Dec 13 318/322 CCS for 0.34 when the market opened lower.
You could do better now or move up a strike. At the time the short was at delta 15-16.
5 contracts so max risk around $1700 with commissions.
Will wait on adding put spread until a bigger pull back.
Plan is to add new positions each week and manage at 21 DTE or 50% profits, or big movement to the short strike whichever occurs first. If the short delta hits 30-32 would modify.
UVXY closed
#Earnings Sold to close final $UVXY Jan 2020 20 puts for 4.75. Avg purchase price 1.85. Still holding long $VXX 20 puts.
#coveredcalls TWTR Rolled Nov. 15,…
#coveredcalls TWTR
Rolled Nov. 15, 30.50 call to Dec. 20, 31 call for .58. TWTR shares were assigned, cost basis is 33.11
TSLA
#ShortCalls Rolled Nov 15 342.50 call to Nov 22 350 call for .63 credit. This is paired with a Jan2021 180 short put. Wouldn’t mind owning TSLA down there at 180.
UDOW
#ShortPuts – First time in this one. Aggressive sale inside the expected move but at the 50ma.
Sold UDOW DEC 20 2019 105.0 Put @ 2.90
Long term Pharm plays
Two small caps have some binary events coming up, and I wanted to play them.
$ADMP – Adamis Pharmaceuticals has a delayed PDUFA response from FDA on a higher dose Naloxone injection. Supposed to come out Oct 31st, but has been delayed. Open interest on the $2.50 Calls for Dec 2019 and March 2020 are over 19,000 this morning, but going out all the way to June didn’t cost much. BTO 5x $2.50 Call 6/19/20 at $0.20 at $1.00 debit. Price target for next few months would be $3-4.00 on the stock with approval, expecting total loss/lottery ticket with a CRL or other bad news. Stock is trading at about $1.00 this morning.
$AGRX – Agile Therapeutics has a contraceptive patch Twirla, with a PDUFA date of Nov. 16th. They’ve had two previous CRLs in the past years on the patch, but an advisory committee met late October and overwhelmingly supported it due to a lack of similar products. BTO 1x $2.50 Call 6/19/20 at $0.90. Price target would be $4.00, I will keep this one into next year most likely regardless of outcome. Stock is at about $2.24 at time of post.
There’s a great website I use that summarizes upcoming Biotech/Pharma dates, pipelines, etc. if anyone is interested: https://www.biopharmcatalyst.com/
Disclaimer: I’ve only used free services on this site, like their FDA calendar and weekly watch lists. Never paid money for subscription services as I’ve seen mixed reviews online.
BIDU Earnings
Bought the following on 11/6 in anticipation of BIDU earnings after hours same day:
1x 11/8 $120 Call, 1x 11/8 $125 Call, 2x 11/8 $130 Call at Debit of: $1.19.
BIDU failed to break some overhead resistance after hours, so I figured I’d get out with a small win– sold all positions for $1.72 about an hour after open on Thursday– should’ve hung on a bit more as the stock blasted about $6 higher during midday trading and my $120 Call would’ve been closer to $4.85 or so by itself. That’s one thing I love about options trading as you get lessons everyday!
DERM Earnings
Took a position in $DERM for earnings on 11/5 (stock around $6.80 or so)- BTO 3x $8.00 Calls exp. 11/15 at $0.13. Stock didn’t pop too much after earnings, but their biggest competitor $ANAB failed on their Phase 2b. STC the same calls on Friday for $0.97 a piece, for a net profit of $252.00.
Expirations
The Good, Expiring worthless:
$SPX Nov 8th 3040/3060-3110/3130 condors, sold yesterday for .80
$DIS Nov 8th 130/128 put spreads, sold yesterday for .65
The Bad, although not Ugly,
$MNST Nov 8th 59/60.5/62 EM call butterfly, bought yesterday for .205
$HUM Nov 8th EM put and call butterflys, bought for .32 total on Tuesday
First time I tried these, both could have been exited for small profit at one point, but I waited to see if I could get more.
UVXY
#ShortCalls – Cleaning up a few of these…
Bought to Close UVXY NOV 15 2019 25.0 Calls @ .06 (sold for .69)
Bought to Close UVXY DEC 20 2019 40.0/50.0 Bear Call Spreads @ .10 (sold for 1.30)
SPX 1-dte risk reversal
#SPX1dte After getting stopped out on call side last Friday and Monday, I am taking a bullish bet for Monday, since yesterday and today SPX was nearly flat. Time for another surge.
Sold to Open $SPX Nov 11th 3065/3045 put spread for .68 credit
Bought to open Nov 11th 3110/3125 call spreads for .28 debit
I did the above as one trade for a .40 credit. If we gap open I will look to sell the call spread early.
The Haps Next Week
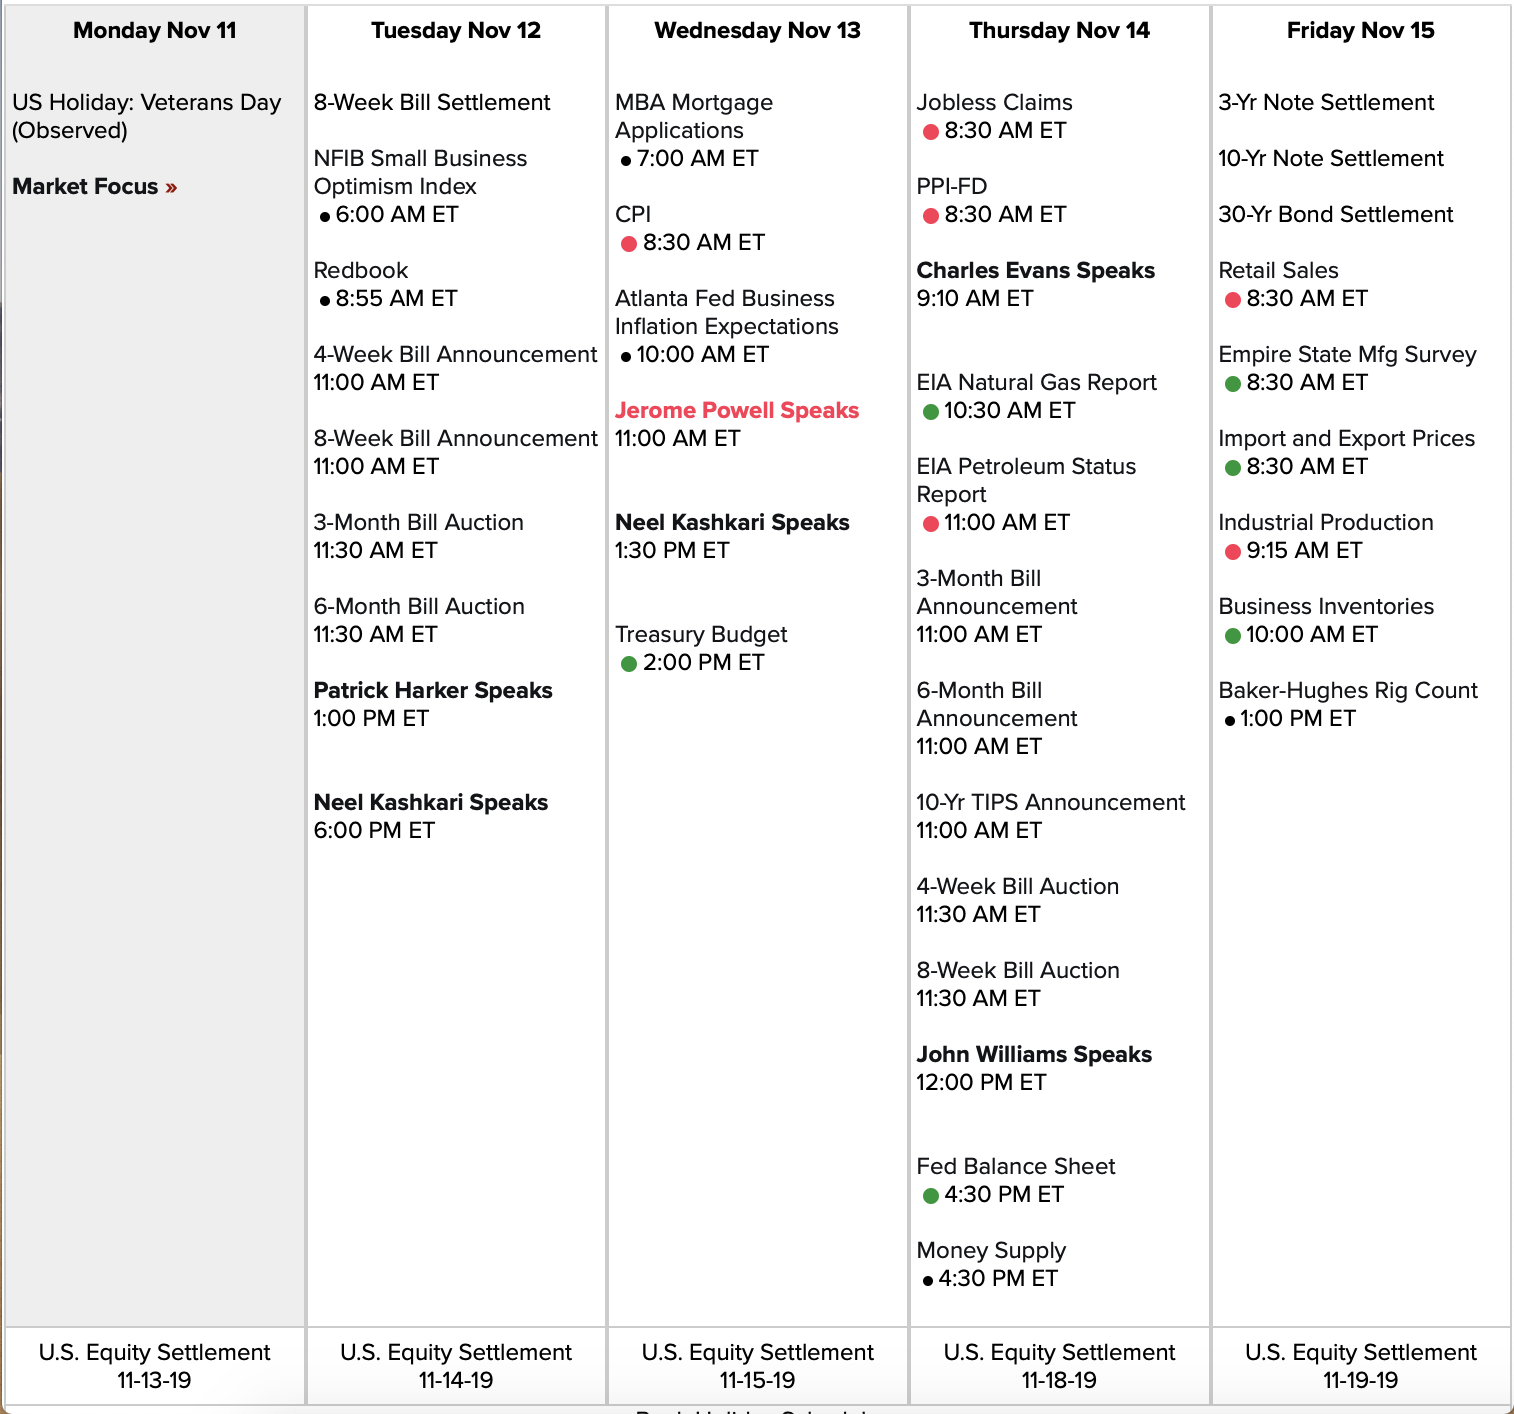

Link to calendar: https://us.econoday.com/byweek.asp?day=11&month=11&year=2019&cust=us&lid=0
SQ
#CoveredCalls – Finally got out of these at a nickel after quite a few rolls collecting premium.
Bought to Close SQ NOV 8 2019 63.0 Calls @ .05 (sold for 3.90)
Sold SQ NOV 22 2019 63.5 Calls @ 1.21
ROKU put spread
Sold $ROKU 12/20 105/95 bull put spread @ 1.78. Stock at 121.06. Delta of short puts 21.
REGN WYNN
#CoveredCalls – Incredibly strong market so tough to do much with ITM covered calls. Trying a couple different things on these two. Looking forward to being out of these since they are the last of my bad entries in this particular account.
REGN – Assigned this stock at 380 and rode it all the way down to 270 while selling calls against. Reduced basis to 323 but now caught in the move up. One more roll to wait for a pullback. If that doesn’t happen I’ll let stock go and switch to some put selling to get the last few dollars needed.
Rolled REGN NOV 08 2019 305.0 Call to DEC 27 2019 310.0 Call @ .04 credit
WYNN: Not many good rolling options on this one so letting the stock go at 107. Basis on 200 shares was 113 so 6 dollar loss. Similar to the recent TNA repair I’m selling an extra put to get the entire 12 dollars back. See where these end up and go from there.
Sold 3 WYNN DEC 13 2019 122.0 Puts @ 4.05
EXPE Falling Knife
Sold $EXPE Apr 17 2020 75 puts @ 1.20
SQ closed
#Earnings . Sold to close $SQ Nov08/Nov15 61 #DoubleCalendar for 1.00. Bought Wednesday for .48
NFLX IBM BUPS Closed Early
#bups
$NFLX BTC 11/15 265/275 BUPS at .40. STO 10/17 at 1.60. Thank you @Raime
$IBM BTC 11/15 130/135 BUPS at .40. STO 10/17 at 2.25.
DIS bullish
#Earnings . Sold to Open $DIS Nov 8th 130/128 put spread for .65.
SPX 1-dte
#SPX1dte Sold to Open $SPX Nov 8th 3040/3060-3110/3130 condors for .80, IV 7.69%, SPX 3085
#earning Strangle $UBER
$UBER STO 11/8 27.50/33.5 at 1.95. BTC @ .60. Thank you @jeff.
MNST earnings analysis
#Earnings $MNST reports tonight. Below are details on earnings one-day moves over the last 12 quarters.
Aug. 7, 2019 AC +2.96%
May 2, 2019 AC +8.82%
Feb. 27, 2019 AC +8.66%
Nov. 7, 2018 AC -3.16%
Aug. 8, 2018 AC +2.65%
May 8, 2018 AC -7.47%
Feb. 28, 2018 AC -14.43% Biggest DOWN
Nov. 8, 2017 AC +1.17%
Aug. 8, 2017 AC -1.14%
May 4, 2017 AC +3.30%
March 1, 2017 AC +12.75% Biggest UP
Nov. 3, 2016 AC -3.55%
Avg (+ or -) 5.84%
Bias 0.88%, positive bias on earnings.
With stock at 56.75 the data suggests these ranges:
Based on current IV (expected move into Friday per TOS): 52.63 to 60.87
Based on AVERAGE one-day move over last 12 quarters: 53.44 to 60.06
Based on MAXIMUM one-day move over last 12 Q’s (14.4%): 48.56 to 64.94
Based on UP max only (+12.8%): 63.99
Open to requests for other symbols.
#earnings DIS Sold Dec. 20,…
#earnings DIS
Sold Dec. 20, 120/145 strangle for 1.51
Thanks for the data Jeff.
ISRG
#ShortPuts – Strong market so trying to squeeze a little more out of this one. Rolling current short put up to support at the 50 and 200 moving averages and also at the expected move over the next two weeks. Wouldn’t break my heart if this catches some heat.
Rolled ISRG NOV 22 2019 505.0 Put to NOV 22 2019 530.0 Put @ 2.00 credit (5.50 total now)
#spycraft Version 6.1 or so….
Version 6.1 or so.
Trying these again with a small account. Starting value around 6k. They work, the issue is controlling the 1 or 2 out of 10 that go against you and wipe out the gains on the other 8-9.
Here are the mechanics.
Start 28-45 DTE. Sell the 16 delta puts or calls then buy options 3-5 strikes outside that. Manage at 21 DTE or 50% profit, whichever is first.
Set up as ladder so add new positions each Thursday or Friday. As they are managed, roll or close.
Adjustments: back ratio works if you catch it early. The problem is it usually reverses then you lose some on the spread and the back ratio. But if you are going to back ratio I would do it when the delta of the short option doubled to 32.
Other options are convert to butterfly when it hits the short strike. You will still lose but will be much less and if you happen to get a pin then could make some money.
Final option is convert it to a diagonal or calendar. This depends on your outlook for the time the short option is in play.
Will also leg into iron condors depending on overall direction.
Nothing more complex than that.
Plan to start in 2 weeks when my current XBI puts expire in this account. Will post results monthly or so but will post the weekly trades as I open them.
DIS earnings analysis
#Earnings $DIS reports tonight. Below are details on earnings one-day moves over the last 12 quarters.
Aug. 6, 2019 AC -4.94% Biggest DOWN
May 8, 2019 AC -1.03%
Feb. 5, 2019 AC -1.10%
Nov. 8, 2018 AC +1.72%
Aug. 7, 2018 AC -2.21%
May 8, 2018 AC -1.78%
Feb. 6, 2018 AC -1.32%
Nov. 9, 2017 AC +2.04%
Aug. 8, 2017 AC -3.87%
May 9, 2017 AC -2.15%
Feb. 7, 2017 AC 0.00%
Nov. 10, 2016 AC +2.86% Biggest UP
Avg (+ or -) 2.09%
Bias -0.98%, negative bias on earnings.
With stock at 132.5 the data suggests these ranges:
Based on current IV (expected move into Friday per TOS): 127.48137.42
Based on AVERAGE one-day move over last 12 quarters: 129.74 to 135.26
Based on MAXIMUM one-day move over last 12 Q’s (4.9%): 125.95 to 139.05
Based on UP max only (+2.9%): 136.29
Open to requests for other symbols.
Earnings blow up EXPE
Did not take my own advice, tried another earnings trade and now losing 6 out of 9. EXPE missed earnings by 0.60 and down over night by 17. Opened this morning down 31 or 22%. Had a #jadelizard at 125/144/145. Obviously the 125 are now way ITM.
Converted to a #fuzzy but will take a long time to make the loss back. Bought the 2022 125 put for 27.92 plus will use some more cash to roll my short put down and out.
Will let the call side expire worthless just to now spend any more money on the trade. This had been my biggest winner for the year. 1 night wiped out 11 months of gains on EXPE.
SPXpire
#SPX1dte Expiring: $SPX Nov 6th 3040/3050-3100/3110 condors, sold yesterday for .50.
#earnings #ROKU #ironcondor I’ll not…
#earnings #ROKU #ironcondor BIDU #shortstrangles
ROKU I’ll not try and bell the cat again. Sold Dec. 20, 105/110/180/185 for 1.49, will probably add a cheap long put and call in case of a blow out.
ROKU Bought Nov. 15, 195/205 call spread for .27
BIDU Sold Nov. 15, 97/120 strangle for 1.83.
Thank you Jeff for the data.
SQ earnings analysis
#Earnings $SQ reports tonight. Below are details on earnings one-day moves over the last 12 quarters.
Aug. 1, 2019 AC -14.05% Biggest DOWN
May 1, 2019 AC -7.98%
Feb. 27, 2019 AC +2.42%
Nov. 7, 2018 AC -9.02%
Aug. 1, 2018 AC +8.65%
May 2, 2018 AC +1.13%
Feb. 27, 2018 AC +0.30%
Nov. 8, 2017 AC +3.40%
Aug. 2, 2017 AC -4.68%
May 3, 2017 AC +8.86%
Feb. 22, 2017 AC +14.02% Biggest UP
Nov. 1, 2016 AC +6.41%
Avg (+ or -) 6.74%
Bias 0.79%, positive bias on earnings.
With stock at 61.00 the data suggests these ranges:
Based on current IV (expected move into Friday per TOS): 55.48 to 66.52
Based on AVERAGE one-day move over last 12 quarters: 56.89 to 65.11
Based on MAXIMUM one-day move over last 12 Q’s (14.1%): 52.43 to 69.57
Based on UP max only (+14.0%): 69.55
Open to requests for other symbols.
ROKU earnings analysis
#Earnings $ROKU reports tonight. Below are details on earnings one-day moves over its entire history (8 quarters).
Aug. 7, 2019 AC +20.85%
May 8, 2019 AC +28.11%
Feb. 21, 2019 AC +25.23%
Nov. 7, 2018 AC -22.29% Biggest DOWN
Aug. 8, 2018 AC +21.31%
May 9, 2018 AC -1.71%
Feb. 21, 2018 AC -17.71%
Nov. 8, 2017 AC +54.93% Biggest UP
Avg (+ or -) 24.02%
Bias 13.59%, strong positive bias on earnings.
With stock at 143.00 the data suggests these ranges:
Based on current IV (expected move into Friday per TOS): 122.94 to 163.06
Based on AVERAGE one-day move over last 8 quarters: 108.65 to 177.35
Based on MAXIMUM one-day move over last 8 Q’s (54.9%): 64.45 to 221.55
Based on DOWN max only (-22.3%): 119.30
Open to requests for other symbols.
SPOT call spread
Falling off the post earnings high after hitting resistance. Sold $SPOT 12/20 160/170 bear call spread @ 1.40.
#earnings QCOM Sold Dec. 20,…
#earnings QCOM
Sold Dec. 20, 72.50/95 strangle for 1.22.
BIDU earnings analysis
#Earnings $BIDU reports tonight. Below are details on earnings one-day moves over the last 12 quarters.
Aug. 19, 2019 AC +4.31%
May 16, 2019 AC -16.51% Biggest DOWN
Feb. 21, 2019 AC -2.70%
Oct. 30, 2018 AC +3.64%
July 31, 2018 AC -7.73%
April 26, 2018 AC +5.54%
Feb. 13, 2018 AC +4.56%
Oct. 26, 2017 AC -8.15%
July 27, 2017 AC +9.45% Biggest UP
April 27, 2017 AC -4.06%
Feb. 23, 2017 AC -5.12%
Oct. 27, 2016 AC +2.56%
Avg (+ or -) 6.19%
Bias -1.18%, negative bias on earnings.
With stock at 109.00 the data suggests these ranges:
Based on current IV (expected move into Friday per TOS): 100.94 to 117.06
Based on AVERAGE one-day move over last 12 quarters: 102.25 to 115.75
Based on MAXIMUM one-day move over last 12 Q’s (16.5%): 91.00 to 127.00
Based on UP max only (+9.5%): 119.30
Open to requests for other symbols.
HUM butterflys
#Earnings . Following @mortlightman here, although I would still like to know, Mort, why you only went with the downside. Also, what is exit plan….. do you want for price to go near your center strike or just get out quickly?
Bought $HUM Nov 8th 280/282.5/285 put butterflys for .15
Bought $HUM Nov 8th 305/307.5/310 call butterflys for .17
SPX 1-dte
#SPX1dte Sold to Open $SPX 3040/3050-3100/3110 condors for .50, 10-wide, double sized.
IV 7.31%, SPX 3078.
UBER off
#Earnings Bought to close $UBER Nov 8th 27.5 puts for .75. #ShortStrangles sold yesterday for 1.86. I’ll let the 33.5 calls expire.
UBER
Could not post yesterday, wordpress problem???
BTO UBRE Nov 8 Put BF 29.5/27.5/25.5 $0.25 seems to be working fine. This is an Expected Move earnings BF small risk big potential from Don Kaufman
#earnings IONS Sold Dec. 45/65…
#earnings IONS
Sold Dec. 45/65 strangle for 1.40.
Bought some insurance, Nov. 22 45/65 straddle for .44
#rolling SMH October 8, sold…
#rolling SMH
October 8, sold a 97/128 strangle for 1.05. October 9 SMH started going up and up. Today rolled to Dec. 105/128 for 2.01. SMH is at 133.
TNA
#ShortPuts – Finally out of this one. It was a repair trade on some covered calls that were exercised early for a loss. Turned around and sold ITM puts to make it up. Ended with a small profit.
Bought to Close TNA NOV 08 2019 60.0 Puts @ .10 (sold for 1.00 after adding in loss repair)
CPRI earnings analysis
#Earnings $CRPI reports tomorrow morning. Below are details on earnings one-day moves over the last 12 quarters.
**CPRI was formerly $KORS. The most recent 3 quarters (at top) are CPRI, the remainder are KORS.
Aug. 7, 2019 BO +3.07%
May 29, 2019 BO -9.84%
Feb. 6, 2019 BO +11.29%
—————————
Nov. 7, 2018 BO -14.62% Biggest DOWN
Aug. 8, 2018 BO +6.72%
May 30, 2018 BO -11.44%
Feb. 7, 2018 BO +1.02%
Nov. 6, 2017 BO +14.69%
Aug. 8, 2017 BO +21.54% Biggest UP
May 31, 2017 BO -8.51%
Feb. 7, 2017 BO -10.80%
Nov. 10, 2016 AC -3.97%
Avg (+ or -) 9.79%
Bias -0.07%, no sign bias on earnings.
With stock at 34.00 the data suggests these ranges:
Based on current IV (expected move into Friday per TOS): 30.13 to 37.87
Based on AVERAGE one-day move over last 12 quarters: 30.67 to 37.33
Based on MAXIMUM one-day move over last 12 Q’s (21.5%): 26.68 to 41.32
Based on DOWN max only (-14.6%): 29.03
Open to requests for other symbols.
UVXY
#ShortCalls -Booking and selling again…
Bought to Close UVXY NOV 8 2019 25.0 Calls @ .04 (sold for .72)
Sold UVXY DEC 6 2019 24.0 Calls @ .70
WBA
STO December 20, 60 puts at 3.00 this morning.
REGN Earnings
#ShortPuts #Earnings – No sense holding this for the rest of the week…
Bought to Close REGN NOV 08 2019 305.0 Put @ .30 (sold for 4.90)
#closing GRUB Bought Dec. 30…
#closing GRUB
Bought Dec. 30 put for .56, sold Friday for 1.05.
HUM earnings analysis
#Earnings $HUM reports tomorrow morning. Below are details on earnings one-day moves over the last 12 quarters.
July 31, 2019 BO +4.29%
May 1, 2019 BO -3.62%
Feb. 6, 2019 BO -0.54%
Nov. 7, 2018 BO +6.68% Biggest UP
Aug. 1, 2018 BO +1.26%
May 2, 2018 BO -2.54%
Feb. 7, 2018 BO -1.56%
Nov. 8, 2017 BO -5.00% Biggest DOWN
Aug. 2, 2017 BO +4.47%
May 3, 2017 BO -0.70%
Feb. 8, 2017 BO +2.25%
Nov. 4, 2016 BO +1.27%
Avg (+ or -) 2.85%
Bias 0.52%, positive bias on earnings.
With stock at 297.50 the data suggests these ranges:
Based on current IV (expected move into Friday per TOS): 285.04 to 309.96
Based on AVERAGE one-day move over last 12 quarters: 289.03 to 305.97
Based on MAXIMUM one-day move over last 12 Q’s (6.7%): 277.63 to 317.37
Based on DOWN max only (-5.0%): 282.63
Open to requests for other symbols.
TGT put spread
Sold $TGT 12/20 105/100 bull put spread @ 1.46 with the stock at 108.89 and looking like it’s bounced off the lower bollinger band, now above the 50dma. Earnings 11/20 so looking for a quick exit here.
“If it ain’t Boeing I ain’t going”
Well at least that’s what we used to say 20 years ago. Now…not so much.
Bought to close $BA 11/15 330/320 bull put spread @ .76. Sold for 1.85 on 10/23.
UBER earnings analysis
#Earnings $UBER reports tonight. Below are details on earnings one-day moves over its entire history.
Option premium and IV is high… expected move is much higher than its previous maximum move.
Aug. 8, 2019 AC -6.79%
May 30, 2019 AC +1.53%
Avg (+ or -) 4.16%
Bias -2.63%, negative bias on earnings.
With stock at 30.50 the data suggests these ranges:
Based on current IV (expected move into Friday per TOS): 26.21 to 34.79
Based on AVERAGE one-day move over last 2 quarters: 29.23 to 31.77
Based on MAXIMUM one-day move over last 2 Q’s (6.8%): 28.43 to 35.27
Based on UP max only (+1.5%): 30.97
Open to requests for other symbols.
REGN earnings analysis
#Earnings $REGN reports tomorrow morning. Below are details on earnings one-day moves over the last 12 quarters.
Aug. 6, 2019 BO +0.23%
May 7, 2019 BO -6.34% Biggest DOWN
Feb. 6, 2019 BO -3.43%
Nov. 6, 2018 BO +0.75%
Aug. 2, 2018 BO +6.99% Biggest UP
May 3, 2018 BO -1.25%
Feb. 8, 2018 BO -3.58%
Nov. 8, 2017 BO +2.66%
Aug. 3, 2017 BO -2.03%
May 4, 2017 BO +6.70%
Feb. 9, 2017 BO +1.91%
Nov. 4, 2016 BO +1.60%
Avg (+ or -) 3.12%
Bias 0.35%, slight positive bias on earnings.
With stock at 312.50 the data suggests these ranges:
Based on current IV (expected move into Friday per TOS): 296.19 to 328.81
Based on AVERAGE one-day move over last 12 quarters: 302.74 to 322.26
Based on MAXIMUM one-day move over last 12 Q’s (7.0%): 290.66 to 334.34
Based on DOWN max only (-6.3%): 292.69
Open to requests for other symbols.
REGN
#CoveredCalls #Earnings – Earnings in the morning and holding a 305 strike covered call. Turning it into a covered strangle now by selling the corresponding put.
Sold REGN NOV 08 2019 305.0 Put @ 4.90
