
#VIXIndicator We closed with $VIX only 0.10 above the cancelation level of the Downside Warning, which has been in effect since October 5th. If bears are going to show up, they better do it soon.
Monthly Archives: January 2019
Double Calendar trades
Bought $HON Feb01/Feb08 144 for .85
Bought $MRK Feb01/Feb08 74.5 for .47
Bought $EW Feb01/Feb08 170 for 1.57
#earnings #shortputspread AMZN Sold March…
#earnings #shortputspread AMZN
Sold March 15, 1490/1500 put spread for 1.41
#lizardpies XBI decayed enough I…
XBI decayed enough I rolled it to an 83/83/83.5 jade lizard for 1.59 credit. cb 81.41 if assigned.
DECK condor
#Earnoings #IronCondor Sold to Open $DECK Feb 1st 105/110/145/150 iron condors for .85
AMZN condor
#Earnings #IronCondor Sold to Open $AMZN Feb 1st 1590/1600-1870/1880 iron condors for 2.00.
SPY 21dte
Closed 6 pcs on 3 SPY 21dte ICs @ .05. Sold for .20 each. Profit $90. Hopefully the turtle wins the race because I am the turtle.
STO replacement pcs at 16 delta.
#spycraft
#earnings #shortstrangles DECK Sold March…
#earnings #shortstrangles DECK
Sold March 15, 100/150 strangle for 2.12, stock is at 126.
SPX 1-dte
#SPX1dte Sold $SPX Feb 1st 2630/2650-2745/2765 iron condors for 1.00. (IV 15.35%; SPX 2703)
FB Roll
This seems like a stretch but I will watch closely
#rolling
$FB BTC 2/1 152.50 call and STO 2/15 165 call at 9.70 debit but would gain 12.50 if called away.
AMAT LABU SMH SOXL TNA TQQQ URI UVXY XBI
#LongCalls #CoveredCalls #LEAPS #ShortPuts – Been a slow couple weeks with the rally and being busy at work. Pretty much all hands on deck to keep things going with this crazy weather! Rolling some covered calls and ratio’d short calls against LEAPS and booking a couple winners for safety. Haven’t been adding anything new…just working with what I’ve got and trying to streamline things a little and be better about adding anything.
AMAT: Ratio’d and rolling just a week to stay prior to earnings.
Rolled AMAT FEB 1 2019 36.0 Calls to FEB 8 2019 36.0 Calls @ .10 credit
LABU: One contract DITM roll below basis…my least favorite position right now but can roll as long as needed.
Rolled LABU FEB 15 2019 35.0 Call JUN 21 2019 40.0 Call @ .01 credit
SMH: Ratio’d roll. Trying to stay as short term as possible.
Rolled SMH FEB 8 2019 91.0 Calls to FEB 22 2019 91.5 Calls @ .17 credit
SOXL: This was ITM not long ago so booking it. Sell again on next pullback.
Bought to Close SOXL FEB 15 2019 75.0 Put at .55 (sold for 3.50)
TNA: Big rally so rolling ratio’d and covered.
Rolled TNA FEB 8 2019 48.5 Calls to FEB 22 2019 49.0 Calls @ even (LEAPS position)
Rolled TNA FEB 1 2019 50.0 Calls to MAR 15 2019 52.0 Calls @ .20 credit (covered)
TQQQ: Added to LEAPS a few days ago so this is ratio’d now.
Rolled TQQQ FEB 8 2019 40.5 Calls to FEB 22 2019 41.0 Calls @ .06 credit
Rolled TQQQ FEB 15 2019 40.0 Call to MAR 15 2019 41.0 Call @ .20 credit (covered)
URI: Book it!
Bought to Close URI FEB 15 2019 105.0 Put @ .20 (sold for 2.30)
UVXY: Rolling short ratio’d puts down. Long LEAP puts working great. This works as a nice hedge on volatility spikes.
Rolled UVXY FEB 15 2019 70.0 Puts to MAR 15 2019 68.0 Puts @ .10 credit
XBI: Ratio’d roll.
Rolled XBI FEB 1 2019 78.0 Calls to FEB 22 2019 79.0 Calls @ .06 credit.
Obviously if I’d seen the Powell capitulation coming I’d not have sold any covered calls. Rolling working fine but capping upside (but giving a nice hedge also). These are all long term positions so working fine. Ratio’d short calls selling below LEAPS is a must. That way the rolls can be gradual since small to no upside risk.
SPX 1-dte
STO SPX Feb1 IC 2650/2655/2740/2745 put/call @.50 x6
BTC early for .10. With the VIX drop at the open, couldn’t resist the quick win.:-)
Profit $240
#spx1-dte
DECK earnings analysis
#Earnings $DECK reports tonight. Below are details on earnings one-day moves over the last 12 quarters.
Oct. 25, 2018 AC +6.18%
July 26, 2018 AC -6.87%
May 24, 2018 AC +3.54%
Feb. 1, 2018 AC +7.30%
Oct. 26, 2017 AC +3.32%
July 27, 2017 AC +1.59%
May 25, 2017 AC +18.80% Biggest UP
Feb. 2, 2017 AC -16.06% Biggest DOWN
Oct. 27, 2016 AC +7.11%
July 28, 2016 AC +4.06%
May 26, 2016 AC +7.99%
Feb. 4, 2016 AC -1.96%
Avg (+ or -) 7.07%
Bias 2.92%, positive bias on earnings.
With stock at 125.50 the data suggests these ranges:
Based on current IV (expected move into Friday per TOS): 112.87 to 138.13
Based on AVERAGE move over last 12 quarters: 116.63 to 134.37
Based on MAXIMUM move over last 12 Q’s (18.8%): 101.91 to 149.09
Open for requests on other symbols.
#optionsexpiration, adjutements, rolls, new trades…
#optionsexpiration, adjustments, rolls, new trades
#lizardpies
XBI 78/82/8.25 should expire tomorrow for 1.26 profit per contract
AMAT BTC the 39 puts for 0.29 that expire tomorrow. Sold for 0.71 last week. Tradestation so can’t trade until tomorrow. I think I will replace it with a #pietrades 108 CC on IBB currently for around 106.89. Obviously that will be different tomorrow.
FAS STO 56 cc for 54.77 expires in 8 DTE
TQQQ batch 1 50 cc rolled out 22 DTE to 51 CC for 0.26 credit. Cb now 57.04 and will have to stay ahead of the rolls.
TQQQ batch 2 50 cc rolled out 36 dTE 51 cc for 0.55 credit. Cb 57.10 and same as above.
#fuzzy
LNG 50/60 8 DTE rolled out to 22 DTE for 0.3 credit. Cb now 13.26
All the others were updated and expire next 1-2 weeks.
Back to even from the start of the October volatility. Now keep working on getting back to even from SVXY losses. Expect at least another 12-24 months unless everything goes perfectly, hahahaha, yeah that would happen 🙂
Something I noticed about #fuzzy over the last 3-4 months. As long as you keep rolling and generating cash they seem to withstand market volatility better than many other trades. In a few small accounts, I generated almost 50% of the value of the account in cash over that time even though the paper value was steadily declining. Have to agree with @fuzzballl, they are flexible. However, going forward I think I will take profit and then reset as we discussed earlier. I think it would make management easier and also lock in profits and also allow you to move the strikes more effectively as the market moves.
Double Calendar Candidates
#Earnings #DoubleCalendar These stocks all have fairly muted historical moves but decent IV elevation for earnings: $CI, $CVX, $HON, $MRK. Also, $EW was my biggest winner in this strategy last quarter. It opened nearly flat and allowed for perfect exit. Then the stock dropped 5%. So its moves are a bit large for a calendar but it worked out, so I may try again.
EW earnings analysis
#Earnings $EW reports tonight. Below are details on earnings one-day moves over the last 12 quarters.
Oct. 23, 2018 AC -5.35%
July 26, 2018 AC -8.50%
April 24, 2018 AC -3.82%
Feb. 1, 2018 AC +3.81%
Oct. 24, 2017 AC -9.55%
July 26, 2017 AC +0.64%
April 25, 2017 AC +10.49% Biggest UP
Feb. 1, 2017 AC -8.45%
Oct. 25, 2016 AC -17.09% Biggest DOWN
July 26, 2016 AC +5.62%
April 26, 2016 AC +0.08%
Feb. 2, 2016 AC +8.33%
Avg (+ or -) 6.81%
Bias -1.98%, negative bias on earnings.
With stock at 170.00 the data suggests these ranges:
Based on current IV (expected move into Friday per TOS): 161.14 to 178.86
Based on AVERAGE move over last 12 quarters: 158.42 to 181.58
Based on MAXIMUM move over last 12 Q’s (17.1%): 140.95 to 199.05
Open for requests on other symbols.
AMZN earnings analysis
#Earnings $AMZN reports tonight. Below are details on earnings one-day moves over the last 12 quarters.
Oct. 25, 2018 AC -7.81% Biggest DOWN
July 26, 2018 AC +0.51%
April 26, 2018 AC +3.60%
Feb. 1, 2018 AC +2.87%
Oct. 26, 2017 AC +13.21% Biggest UP
July 27, 2017 AC -2.48%
April 27, 2017 AC +0.71%
Feb. 2, 2017 AC -3.54%
Oct. 27, 2016 AC -5.13%
July 28, 2016 AC +0.82%
April 28, 2016 AC +9.56%
Jan. 28, 2016 AC -7.60%
Avg (+ or -) 4.82%
Bias 0.39%, small positive bias on earnings.
With stock at 1732.00 the data suggests these ranges:
Based on current IV (expected move into Friday per TOS): 1639.50 to 1824.50
Based on AVERAGE move over last 12 quarters: 1648.52 to 1815.48
Based on MAXIMUM move over last 12 Q’s (13.2%): 1503.20 to 1960.80
Open for requests on other symbols.
TNDM Short Puts / COST BUPS
#shortputs
$TNDM STO 2/15 43 puts at 1.65
#bullputspreads
$COST STO 2/15 207.50/212.50 at 2.20 Earnings scheduled for 3/6
NVDA
#In-Out 142/144 Calls Feb8 $1.05
UPS
#fuzzy Feb 6 -160/159Put +160 Call $1.60
EXAS Short Puts / Close T Short Puts / Roll PVTLCalls / Buy AMZN Calls
#shortputs
$EXAS STO 2/8 85 put @ 1.05
$T BTC 2/15 29 put at .20 STO 1/3 at 1.20
#rolling
$PVTL BTC 2/15 18 call and STO 3/15 19 call for .40 added credit. Covered
#longcalls
$AMZN BTO 2/1 1695 calls at 44
SPX 1-dte defense
Cut risk to zero and made a small profit my SPX Jan31 2710/2715 ccs by buying back the three 2710 calls in the spread I STO near the close yesterday. Position is now a bullish backratio.
Ended up making $430 on this 6 lot trade.
#coveredcallcampaign AAPL Sold Feb. 15,…
#coveredcallcampaign AAPL
Sold Feb. 15, 175 call for .91, cost basis of assigned shares is 173.50
#earnings X Yesterday sold March…
Yesterday sold March 15, 22 straddle for 3.11, bought today for 2.64
SPX 1-dte closed
#SPX1dte Closed both shorts for .05 each. Looks good to expire but this clears needed margin from smaller accounts. $SPX Jan 31st 2615/2635/2735/2755 condors sold yesterday for 1.00
TRADES:
SFIX BTO STOCK 23.12 Day trade
AMD BTO STOCK @24.27 Day trade
#earnings MSFT Yesterday sold March…
#earnings MSFT
Yesterday sold March 15, 95/115 strangle for 1.89, bought today for 1.06, finally an earnings trade behaved appropriately. Now for NOW…
NOW
#bearcallspreads
STO Feb 1 225/230 BeCS for 1.75
Trying to salvage the iron condor that was totally busted by the extreme move this morning.
NFLX
STC on GTC order…FEB 1 325/327.5 BuCS @2.36…BTO 1/18 @ 1.90
#supercharger
SVXY
https://www.bgandg.com/svxy-complaint
EXAS STO Puts / SPX 1 DTE Expired
#shortputs
$EXAS STO 2/1 82 put at .60
#spx1dte
$SPX STO 1/30 2565/2585/2705/2685 IC for 1.10 Bought it this morning and my nails are still on my fingers as it expired worthless. Thank you @jeffcp66
#SVXY
Hi all
For those affect by #SVXY# last year, I was contacted by an attorney in NYC who is filing a class action suit. If interested, here’s his contact info:
P 212.697.6484 M 917‑750‑9429 F 212.697.7296
E eitank@bgandg.com W http://www.bgandg.com/
SPX 1-dte trades
#SPX1dte Sold $SPX Jan 31st 2615/2635-2735/2755 iron condors for 1.00. (IV 16%)
I hated doing this because I feel the rally today is a headfake, but I cannot fight the tape any higher than this.
Bought to close $SPX Feb 14th 2730/2750 call spreads for 5.75. Sold in a #CondorRoll on Jan 4th.
#CondorRoll Sold to Open Feb 14th 2600/2620/2760/2780 condors for 6.05.
Theotrade VIX hedge…
#Hedges -From last weekend’s freebie. Go to the 10:30 mark to see his VIX hedge. Basically sell puts to finance bull call spreads. Could be getting close to time again…
https://theotrade.com/clouded-market-clarity-provides-these-trade-setups/
Jumping back into NUGT
Sold $NUGT Jun 21 35 calls @ 1.01. Highest strike in June.
SPY
Did one of DK’s Back Ratio’s on 1-28
-1 267/+2 271 for .26 cr starting to be profitable
Iceman classic…

SPX
Closed last of SPX Butterfly’s opened 12-31 2625/2650/2675 for 1.35, closed 1 on 1-24 $2.25 just closed rest $2.25
Not sure where we are going, had a nice profit. Did not want it to run right past limits.
#earnings MSFT X TastyTrade ideas…
#earnings MSFT X
TastyTrade ideas
X sold March 15, 22 straddle for 3.11
MSFT sold March 15, 95/115 strangle for 1.89
Thank you for the earnings data Jeff.
TQQQ calls
#LongLEAPs #SyntheticCoveredCalls
Filled on the Fed spike: Sold $TQQQ Feb 15th 44 calls for 2.45
#rolling, adjustments, and new trades…
#rolling, adjustments, and new trades
#fuzzy
MU rolled the 35/35 out 16 DTE for 0.5 credit. Cb now 14.30
WDC 40/40 rolled out 9 DTE for 0.33 credit. Cb now 17.71
I was going to close these at a loss but figure if I can get at least 0.25 per roll will keep rolling to generate cash and lower cost basis. 10 contracts each so decent income.
#pietrades
SQ STO the 9 DTE Feb 8-9 68 put for 1.53. Decided not to jade lizard until after FOMC and see what the market does. If we gap up I will sell the CCS once it has a top or range.
FOMC must have just released up 10 more on /ES. I may #jadelizard SQ into the close if it slows down to the upside.
After 4-5 months of crap trading, finally making some income/cash and money again but I still have a long way to go to recover the SVXY fiasco.
Closed Jan30 SPX 1dte IC early
Closed for .20. Sold for .55 x 6. Total profit $210
#spx1-dte
SPX 1-dte closing
#SPX1dte bought to close $SPX Jan 30th 2685 calls for .85. Condors sold for 1.00 yesterday. Could not hold through the FOMC release that comes out in 40 minutes. I don’t expect a move like last time, when we exploded higher, but can’t risk it. Also sold a couple the long 2705 calls for .05, and will try to sell them all to reduce cost of the exit. Allowing puts to expire.
Don’t know whether I’ll buy or sell the condor for Jan 31st expiration yet!
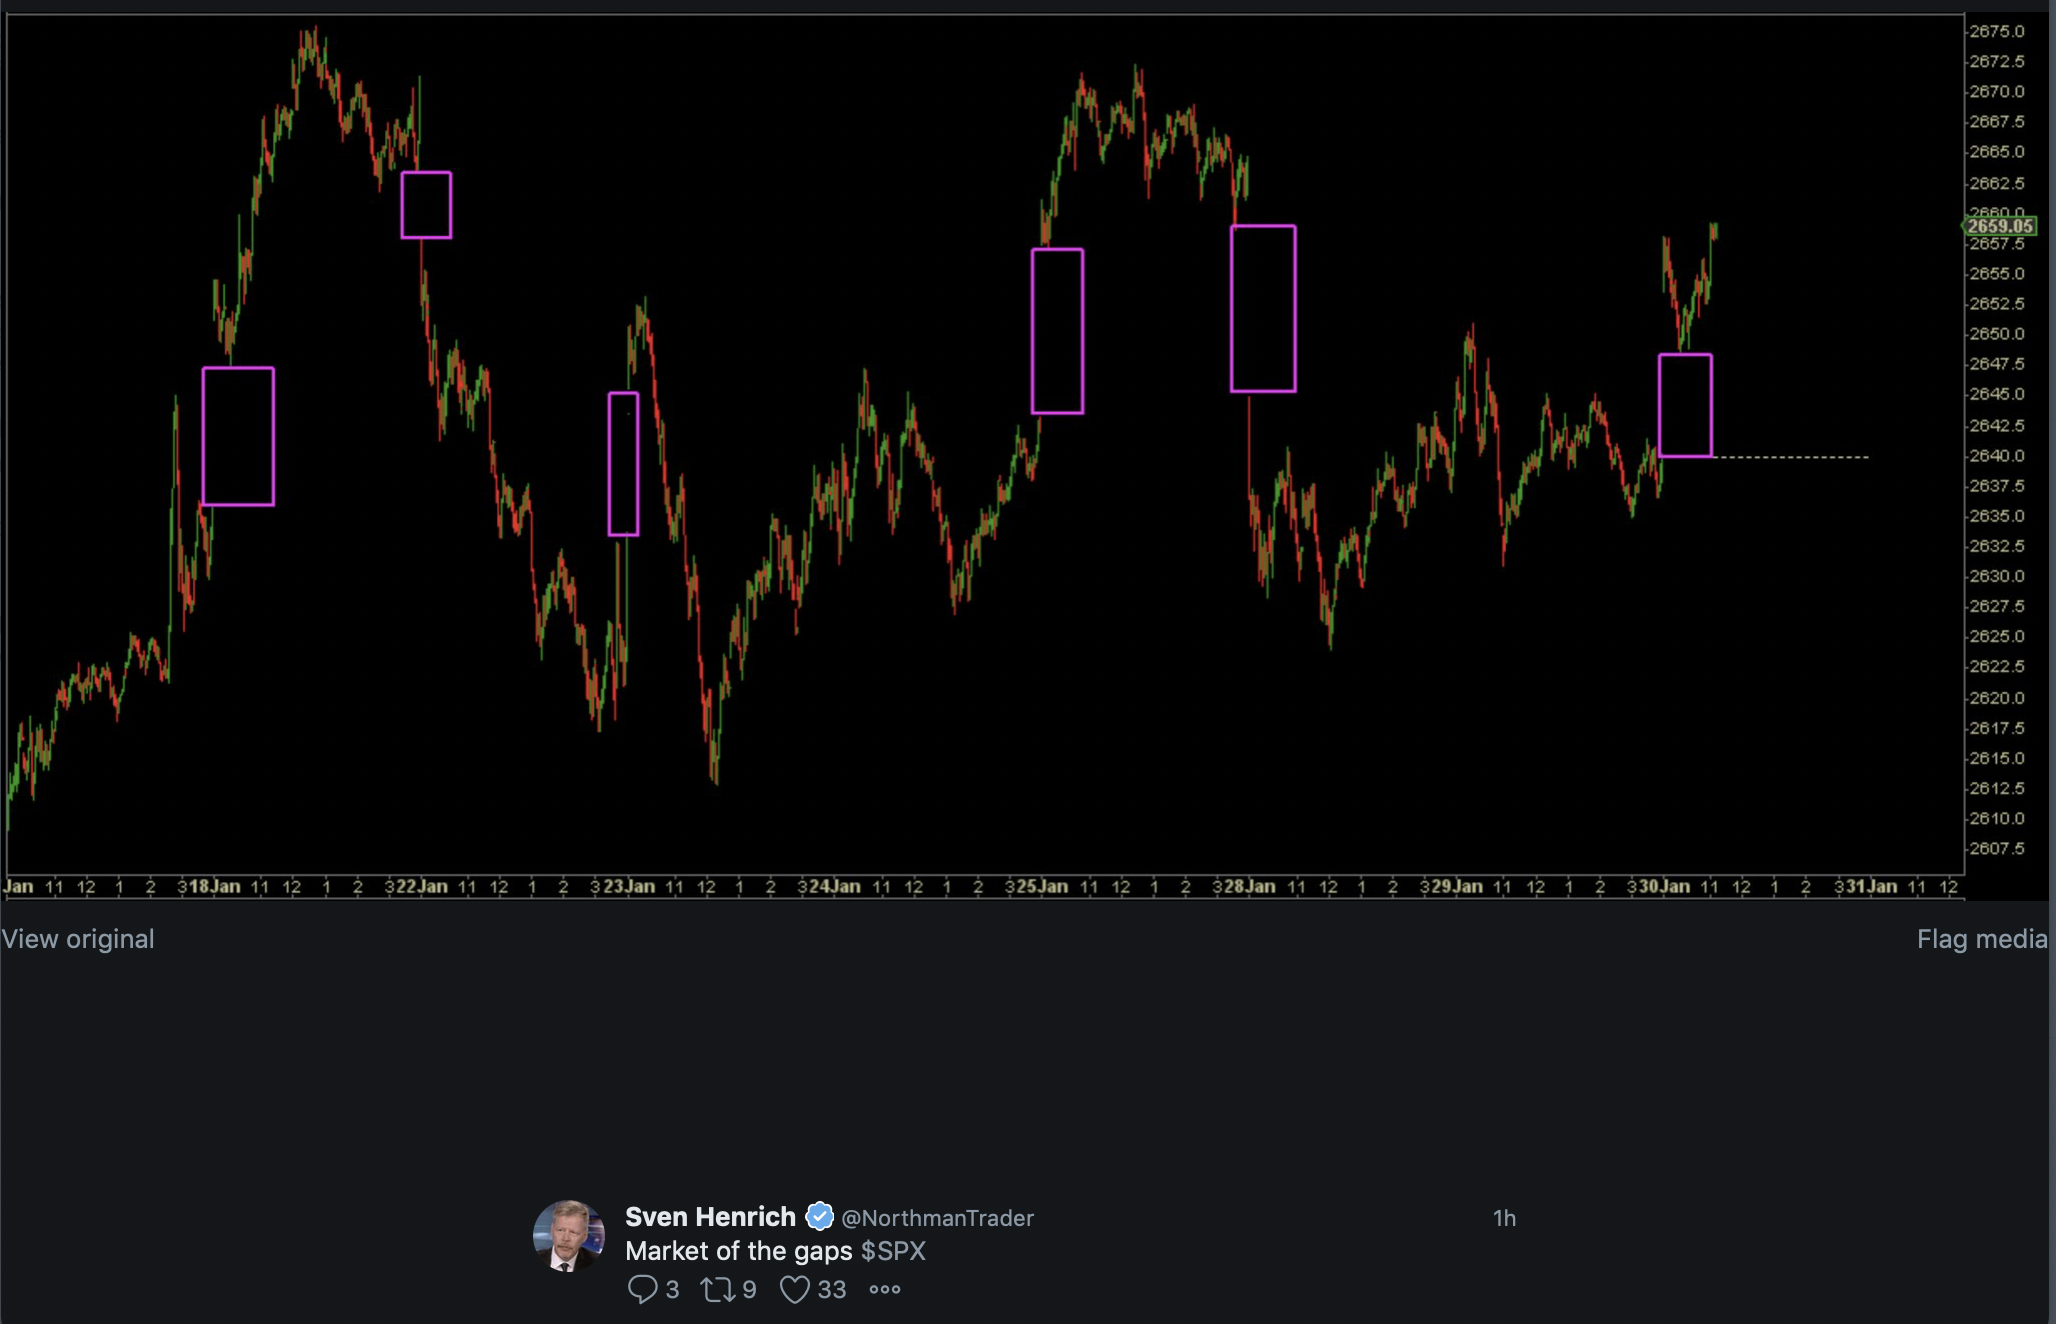
SPX — Market of the Gaps
MSFT earnings analysis
#Earnings $MSFT reports tonight. Below are details on earnings one-day moves over the last 12 quarters.
Oct. 24, 2018 AC +5.84%
July 19, 2018 AC +1.79%
April 26, 2018 AC +1.65%
Jan. 31, 2018 AC -0.78%
Oct. 26, 2017 AC +6.41% Biggest UP
July 20, 2017 AC -0.57%
April 27, 2017 AC +0.27%
Jan. 26, 2017 AC +2.34%
Oct. 20, 2016 AC +4.20%
July 19, 2016 AC +5.31%
April 21, 2016 AC -7.17% Biggest DOWN
Jan. 28, 2016 AC +5.82%
Avg (+ or -) 3.51%
Bias 2.09%, strong positive bias on earnings.
With stock at 105.90 the data suggests these ranges:
Based on current IV (expected move into Friday per TOS): 101.22 to 110.58
Based on AVERAGE move over last 12 quarters: 102.18 to 109.62
Based on MAXIMUM move over last 12 Q’s (7.2%): 98.31 to 113.49
Open for requests on other symbols.
NOW iron butterfly
Sold to open $NOW Feb 1st 185/190/195 iron butterflys for 4.35. Max risk .65. As I reported below, this one has been more of a minor mover in recent years, so seeing if it can maintain its calm. If not, max loss is tolerable.
Long Straddles
#LongStraddle #Earnings
Sold to Close final batch of $GLW Feb 1st 30 calls for 3.27. Netted about 60% profit (bought for 1.92 on Monday).
Sold to close some of the $EBAY Feb 1st 33.5 puts for .61. Straddles bought yesterday for 2.23. This one will be tough to breakeven, unless we get a rally over next couple days.
#shortstrangles #closing SQ January 4…
January 4 sold a Feb. 15, 45/75 strangle for 1.48. SQ was close to 78 recently, bought the strangle today for 1.28, happy after the run-up.
CRUS earnings analysis
#Earnings $CRUS reports tomorrow morning. Below are details on earnings one-day moves over the last 12 quarters.
Nov. 1, 2018 AC +3.10%
Aug. 1, 2018 AC -7.01%
May 2, 2018 AC -1.53%
Feb. 5, 2018 AC -3.31%
Nov. 2, 2017 AC -0.42%
Aug. 2, 2017 AC -6.89%
May 3, 2017 AC +0.10%
Feb. 1, 2017 AC -14.00% Biggest DOWN
Oct. 27, 2016 AC +6.85%
July 27, 2016 AC +19.27% Biggest UP
April 26, 2016 AC +12.38%
Jan. 27, 2016 AC +16.38%
Avg (+ or -) 7.60%
Bias 2.08%, positive bias on earnings.
With stock at 38.00 the data suggests these ranges:
Based on current IV (expected move into Friday per TOS): 35.03 to 40.97
Based on AVERAGE move over last 12 quarters: 35.11 to 40.89
Based on MAXIMUM move over last 12 Q’s (19.3%): 30.68 to 45.32
Open for requests on other symbols.
Covered Calls
#CoveredCalls #LongStock Sold to Open $PVTL Feb 15th 18 calls for .75
NOW earnings analysis
#Earnings $NOW reports tonight. Below are details on earnings one-day moves over the last 12 quarters.
Oct. 24, 2018 AC +1.42%
July 25, 2018 AC +4.60%
April 25, 2018 AC +4.53%
Jan. 31, 2018 AC +2.64%
Oct. 25, 2017 AC +1.21%
July 26, 2017 AC +0.74%
April 26, 2017 AC +3.75%
Jan. 25, 2017 AC +3.61%
Oct. 26, 2016 AC +7.68%
July 27, 2016 AC +4.65%
April 20, 2016 AC +14.06% Biggest UP
Jan. 27, 2016 AC -15.65% Biggest DOWN (the only DOWN)
Avg (+ or -) 5.38%
Bias 2.77%, strong positive bias on earnings.
With stock at 189.90 the data suggests these ranges:
Based on current IV (expected move into Friday per TOS): 117.65 to 202.15
Based on AVERAGE move over last 12 quarters: 179.69 to 200.11
Based on MAXIMUM move over last 12 Q’s (15.7%): 160.18 to 219.62
Open for requests on other symbols.
WYNN earnings analysis
#Earnings $WYNN reports tonight. Below are details on earnings one-day moves over the last 12 quarters.
Nov. 7, 2018 AC -13.13% Biggest DOWN
Aug. 1, 2018 AC -6.53%
April 24, 2018 AC -3.74%
Jan. 22, 2018 BO +8.67%
Oct. 26, 2017 AC -1.50%
July 25, 2017 AC -5.02%
April 25, 2017 AC +5.89%
Jan. 26, 2017 AC +7.93%
Nov. 2, 2016 AC -9.31%
July 28, 2016 AC -6.41%
May 5, 2016 AC +1.77%
Feb. 11, 2016 AC +15.83% Biggest UP
Avg (+ or -) 7.14%
Bias -0.46%, slight negative bias on earnings.
With stock at 117.50 the data suggests these ranges:
Based on current IV (expected move into Friday per TOS): 109.04 to 125.96
Based on AVERAGE move over last 12 quarters: 109.11 to 125.89
Based on MAXIMUM move over last 12 Q’s (15.8%): 98.90 to 136.10
Open for requests on other symbols.
TUP getting hammered
Sold $TUP Jul 19 22.50 puts @ 1.20 with the stock at 27.87
#FallingKnife
FB earnings analysis
#Earnings $FB reports tonight. Below are details on earnings one-day moves over the last 12 quarters.
Oct. 30, 2018 AC +3.80%
July 25, 2018 AC -18.96% Biggest DOWN
April 25, 2018 AC +9.06%
Jan. 31, 2018 AC +3.31%
Nov. 1, 2017 AC -2.04%
July 26, 2017 AC +2.91%
May 3, 2017 AC -0.62%
Feb. 1, 2017 AC -1.79%
Nov. 2, 2016 AC -5.63%
July 27, 2016 AC +1.34%
April 27, 2016 AC +7.19%
Jan. 27, 2016 AC +15.52% Biggest UP
Avg (+ or -) 6.01%
Bias 1.17%, positive bias on earnings.
With stock at 146.00 the data suggests these ranges:
Based on current IV (expected move into Friday per TOS): 136.11 to 155.89
Based on AVERAGE move over last 12 quarters: 137.22 to 154.78
Based on MAXIMUM move over last 12 Q’s (19.0%): 118.32 to 173.68
Open for requests on other symbols.
SPY 21dte ladder
Sold SPY Feb20 274/276 ccs @ .26 x 2. SPY 21dte ladder strat. Will sell pcs on reversal.
Sold SPY Feb20 254/252 pcs @ .20 x2 to complete the IC.
#spycraft
SPX 1-dte IC
Sold SPX Jan30 2710/2715 ccs @ .25 x 6 across two accounts. Will add pcs on reversal.
Sold SPX Jan30 2600/2595 pcs @ .25 x6 across two accounts to complete the IC
Sold 3 more Jan31 2710/2715 ccs @ .75 after fed announcement. This is based on the usual reversal after a spike on the announcement.
#spx1-dte
Events Wednesday
#Market Reminders for tomorrow:
GDP numbers at 8:30am ET
FOMC Meeting Announcement at 2pm ET
SPX 1-dte, short
#SPX1dte Sold to Open $SPX Jan 30th 2565/2585/2685/2705 iron condors for 1.00
I switched back to selling because IV on this chain is over 16% and HV dipped below IV.
#earnings #ironcondor BA Sold Feb….
Sold Feb. 15, 335/340/390/395 IC for 1.31
EBAY earnings trade & analysis
#Earnings $EBAY reports tonight. Below are details on earnings one-day moves over the last 12 quarters.
Bought $EBAY Feb 1st 33.5 straddle for 2.23.
Oct. 30, 2018 AC +5.87%
July 18, 2018 AC -10.11%
April 25, 2018 AC -5.58%
Jan. 31, 2018 AC +13.82% Biggest UP
Oct. 18, 2017 AC -1.79%
July 20, 2017 AC -1.53%
April 19, 2017 AC -3.92%
Jan. 25, 2017 AC +4.99%
Oct. 19, 2016 AC -10.76%
July 20, 2016 AC +10.89%
April 26, 2016 AC +3.18%
Jan. 27, 2016 AC -12.45% Biggest DOWN
Avg (+ or -) 7.07%
Bias -0.62%, slight negative bias on earnings.
With stock at 33.60 the data suggests these ranges:
Based on current IV (expected move into Friday per TOS): 31.39 to 35.81
Based on AVERAGE move over last 12 quarters: 31.46 to 36.24
Based on MAXIMUM move over last 12 Q’s (13.8%): 29.17 to 38.53
Open for requests on other symbols.
BA earnings trade
#Earnings Sold to Open $BA Feb 1st 345/350/380/385 #IronCondor for 1.78. About 3.8% on downside and 4.5% on upside.
SPX weeklies question
Does anyone know why SPX has an extra weekly expiration this week? There are options expiring Mon, Wed, Thurs, and Fri. That happens sometimes with monthly expiration but not usually at EOM.
#shortstrangles MU TastyTrade idea sold…
TastyTrade idea sold March 15, 33/42 strangle for 1.92
BA earnings analysis
#Earnings $BA reports tomorrow morning. Below are details on earnings one-day moves over the last 12 quarters.
Oct. 24, 2018 BO +1.31%
July 25, 2018 BO -0.65%
April 25, 2018 BO +4.19%
Jan. 31, 2018 BO +4.93%
Oct. 25, 2017 BO -2.84%
July 26, 2017 BO +9.87% Biggest UP
April 26, 2017 BO -0.98%
Jan. 25, 2017 BO +4.24%
Oct. 26, 2016 BO +4.68%
July 27, 2016 BO +0.82%
April 27, 2016 BO +2.88%
Jan. 27, 2016 BO -8.92% Biggest DOWN
Avg (+ or -) 3.86%
Bias 1.63%, positive bias on earnings.
With stock at 365.50 the data suggests these ranges:
Based on current IV (expected move into Friday per TOS): 350.40 t0 380.60
Based on AVERAGE move over last 12 quarters: 351.39 to 379.61
Based on MAXIMUM move over last 12 Q’s (9.9%): 329.43 to 401.57
Open for requests on other symbols.
ADVANCE on TSLA
#Earnings $TSLA reports Wednesday night. Below are details on earnings one-day moves over the last 12 quarters.
Oct. 24, 2018 AC +9.13%
Aug. 1, 2018 AC +16.18% Biggest UP
May 2, 2018 AC -5.54%
Feb. 7, 2018 AC -8.62% Biggest DOWN
Nov. 1, 2017 AC -6.79%
Aug. 2, 2017 AC +6.50%
May 3, 2017 AC -5.00%
Feb. 22, 2017 AC -6.40%
Oct. 26, 2016 AC +0.87%
Aug. 3, 2016 AC +2.13%
May 4, 2016 AC -4.95%
Feb. 10, 2016 AC +4.73%
Avg (+ or -) 6.40%
Bias 0.19%, no significant directional bias on earnings.
With stock at 295.00 the data suggests these ranges:
Based on current IV (expected move into Friday per TOS): 263.33 to 326.67
Based on AVERAGE move over last 12 quarters: 276.11 to 313.89
Based on MAXIMUM move over last 12 Q’s (16.2%): 247.27 to 342.73
Open for requests on other symbols.
SPY 21dte ladder
Sold SPY Feb19 IC 274/276/250/248 @ .42 x2. Now have four of six max layers in the ladder. All ICs look fine at this point.
#spycraft
SPX 1dte
#spx1dte Sold SPX Jan30 1dte IC 2690/2695/2590/2585 @ .55 x6 across two accounts. Keeping trade size smaller for a while to recover from over-defending these trades.
AMD earnings analysis
#Earnings $AMD reports tonight. Below are details on earnings THREE-day moves over the last 12 quarters.
***NOTE: These are 3-day moves, since options traded for earnings will expire on Friday. These moves are bigger than 1-day moves. This stock can move BIG.
Wed 10/24/2018 AC -22.64%
Wed 07/25/2018 AC +18.01%
Wed 04/25/2018 AC +14.42%
Tue 01/30/2018 AC -3.26%
Tue 10/24/2017 AC -16.91%
Tue 07/25/2017 AC -1.13%
Mon 05/01/2017 AC -25.84% Biggest DOWN
Tue 01/31/2017 AC +18.03%
Thu 10/20/2016 AC -6.32%
Thu 07/21/2016 AC +11.87%
Thu 04/21/2016 AC +52.29% Biggest UP
Tue 01/19/2016 AC +3.58%
Avg (+ or -) 16.19%
Bias 3.51%, positive bias on earnings.
With stock at 19.60 the data suggests these ranges:
Based on current IV (expected move into Friday per TOS): 17.19 to 22.01
Based on AVERAGE move over last 12 quarters: 16.43 to 22.77
Based on MAXIMUM move over last 12 Q’s (52.3%): 9.35 to 29.85
Open for requests on other symbols.
GLW mostly closed
#Earnings #LongStraddle Sold to close $GLW Feb 1st 30 calls for 3.10. Straddles bought for 1.92 yesterday. I closed two-thirds of my position. Holding the rest for potentially higher prices into Friday.
BABA earnings analysis
#Earnings $BABA reports tomorrow morning. Below are details on earnings one-day moves over the last 12 quarters.
***NOTE: One-day moves are listed, but I included the extremes for 3-day moves as well. As you can see, big moves were followed by continuation for the three days following earnings.
*****NOTE #2: the EXPECTED move (per TOS) is higher than the Maximum 1-day historical moves. A bigger than usual move is expected, which could just mean options are overpriced. Note, however, that the three-day moves exceed the expected.
Nov. 2, 2018 BO -2.41%
Aug. 23, 2018 BO -3.15%
May 4, 2018 BO +3.52%
Feb. 1, 2018 BO -5.90% Biggest DOWN — 3-day = -8.31%
Nov. 2, 2017 BO -0.68%
Aug. 17, 2017 BO +2.77%
May 18, 2017 BO +0.45%
Jan. 24, 2017 BO +3.06%
Nov. 2, 2016 BO -2.60%
Aug. 11, 2016 BO +5.08% Biggest UP — 3-day = +12.5%
May 5, 2016 BO +3.96%
Jan. 28, 2016 BO -3.76%
Avg (+ or -) 3.11%
Bias 0.03%, no directional bias on earnings.
With stock at 157.00 the data suggests these ranges:
Based on current IV (expected move into Friday per TOS): 146.67 to 167.33
Based on AVERAGE move over last 12 quarters: 152.11 to 161.89
Based on MAXIMUM move over last 12 Q’s (5.9%): 147.74 to 166.26
Open for requests on other symbols.
AAPL earnings analysis
#Earnings $AAPL reports tonight. Below are details on earnings THREE-day moves over the last 12 quarters.
***NOTE: These are 3-day moves, since options traded for earnings will expire on Friday. These moves are slightly bigger than 1-day moves.
Thu 11/01/2018 AC -6.63%
Tue 07/31/2018 AC +9.30% Biggest UP
Tue 05/01/2018 AC +8.71%
Thu 02/01/2018 AC -4.34%
Thu 11/02/2017 AC +2.61%
Tue 08/01/2017 AC +4.22%
Tue 05/02/2017 AC +0.98%
Tue 01/31/2017 AC +6.37%
Tue 10/25/2016 AC -3.83%
Tue 07/26/2016 AC +7.79%
Tue 04/26/2016 AC -10.16% Biggest DOWN
Tue 01/26/2016 AC -2.65%
Avg (+ or -) 5.63%
Bias 1.03%, positive bias on earnings.
With stock at 157.00 the data suggests these ranges:
Based on current IV (expected move into Friday per TOS): 148.24 to 165.76
Based on AVERAGE move over last 12 quarters: 148.16 to 165.84
Based on MAXIMUM move over last 12 Q’s (10.2%): 141.05 to 172.95
Open for requests on other symbols.
Farewell old friend…
But #VXXGame lives on.
The big short volatility edition:
10 year ago $VXX was introduced.
Tomorrow $VXX dies.
Every long died along the way. pic.twitter.com/FZpH7RUbKf— Sven Henrich (@NorthmanTrader) January 29, 2019
$NFLX CC Rolled down / $INTC Double Calendar / $WYNN BUCS
#coveredcalls
$NFLX BTC 2/1 360 calls and STO 2/1 252.50 calls at added .50
#doublecalendar
$INTC STC 2/1 51 put at 4.50 Trade ended up losing only $15 per contract and I tried something new. Thank you @jeffcp66
#bullcallspreads
$WYNN BTO 4/18 115/130 BUCS at 6.25
GLW straddle
#Earnings Bought to open $GLW Feb 1st 30 straddle for 1.92. I only need around the average move on this to be profitable.
#earnings #ironbutterfly GLW Went to…
Went to Feb. 15, sold 125/130/130/135 for 2.13, works if it’s within the averages. Thanks Jeff
