
FOMC meeting and press conference on Wednesday at 2pm ET
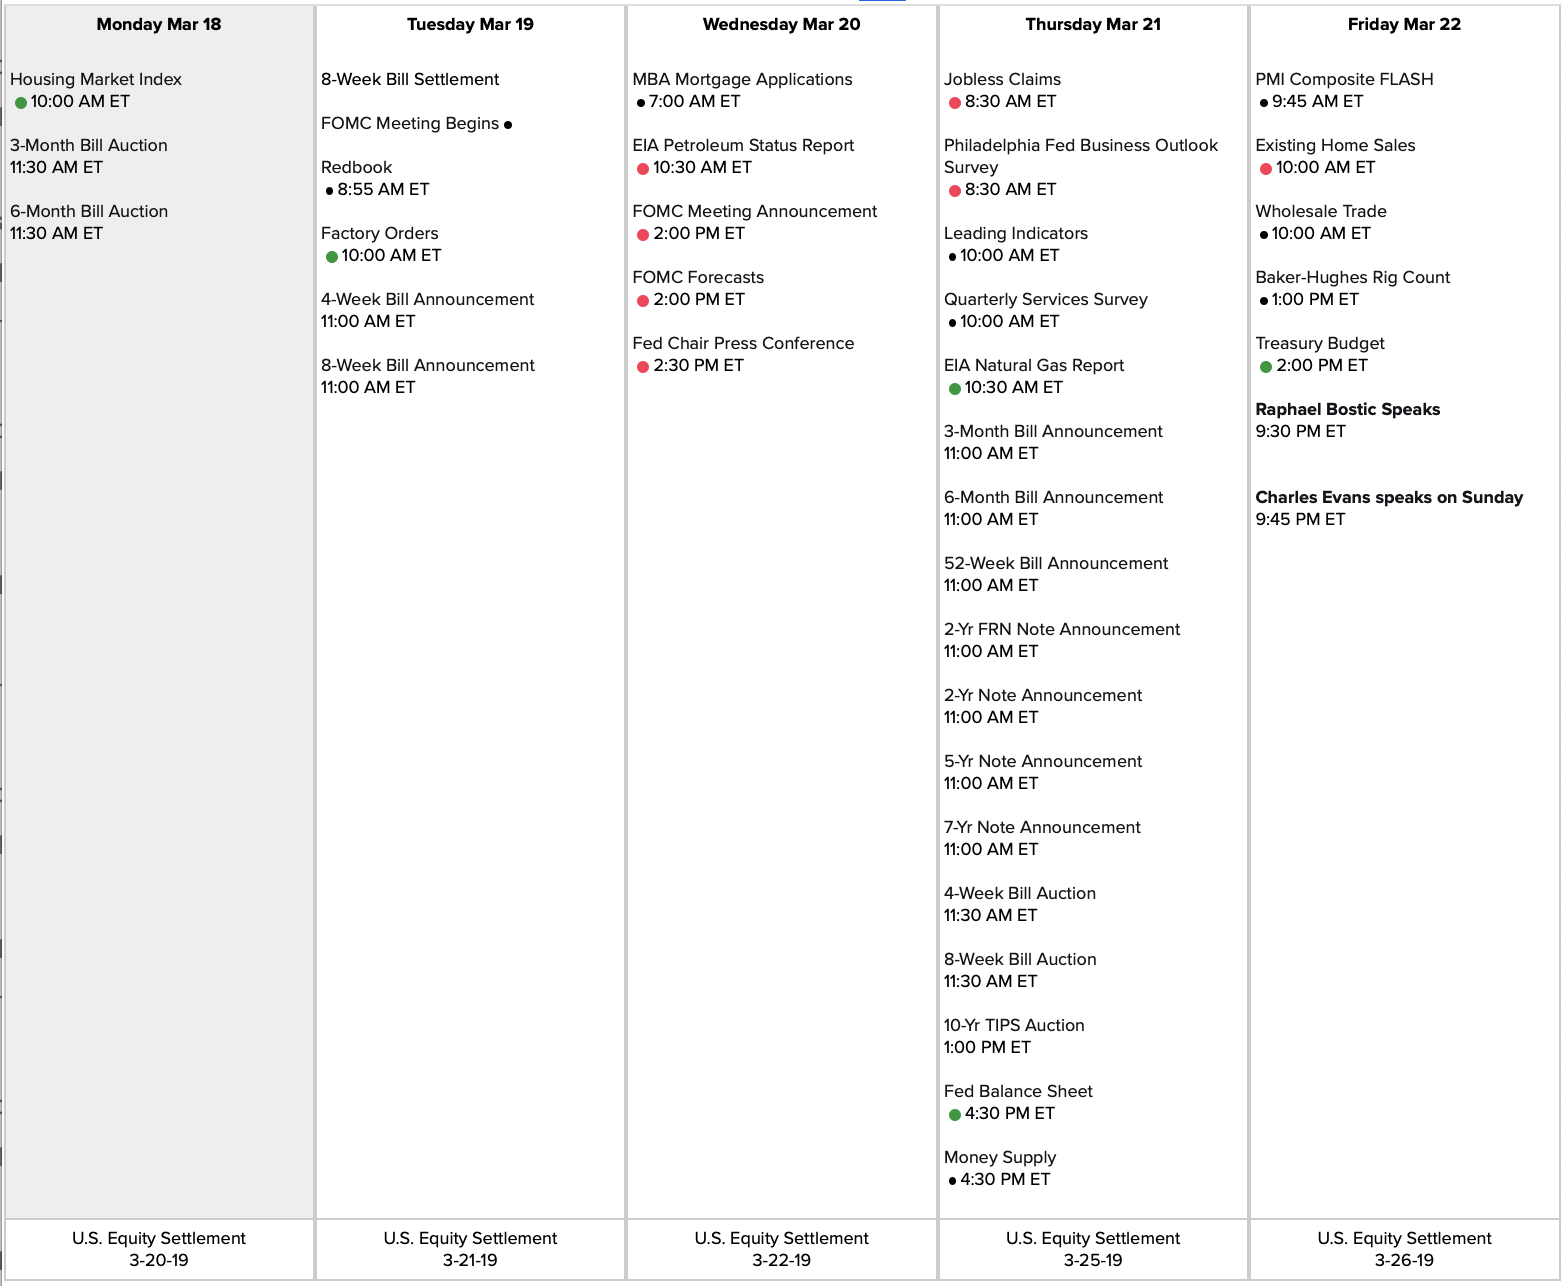

Link to calendar: https://us.econoday.com/byweek.asp?day=18&month=3&year=2019&cust=us&lid=0
FOMC meeting and press conference on Wednesday at 2pm ET
Link to calendar: https://us.econoday.com/byweek.asp?day=18&month=3&year=2019&cust=us&lid=0
#bearcallspreads
$SAM STO 4/18 320/340 BECS at 4.20 I am sober at time of trade
#longcalls
$JD STC 3/15 25/29 BUCS at 3.60. BTO 1/16 at .80
#Earnings Sold to close first batch of $ORCL Mar15/Mar22 53 #DoubleCalendar for .50. Watching for better exit on the next batch. Bought yesterday for .23 and .24
#shortputspread NFLX
Sold April 18, 310/320 for 1.70, earnings currently scheduled for April 16.
#Earnings — $OSTK reports Monday morning. Below are details on earnings FIVE-day moves over the last 12 quarters.
Thu 11/08/2018 AC -12.62%
Thu 08/09/2018 AC -14.77% Biggest DOWN
Tue 05/08/2018 AC -4.19%
Thu 03/15/2018 AC -3.63%
Wed 11/08/2017 AC +40.40% Biggest UP
Thu 08/03/2017 AC +6.99%
Thu 05/04/2017 AC -1.29%
Tue 01/31/2017 AC +1.20%
Thu 11/03/2016 AC +21.75%
Thu 08/04/2016 AC -0.74%
Tue 05/03/2016 AC +2.96%
Tue 02/09/2016 AC +30.59%
Avg (+ or -) 11.76%
Bias 5.55%, positive bias on earnings.
With stock at 20.25 the data suggests these ranges over FIVE days:
Based on current IV (expected move into Friday per TOS): 16.43 to 24.07
Based on AVERAGE move over last 12 quarters: 17.87 to 22.63
Based on MAXIMUM move over last 12 Q’s (40.4%): 12.07 to 28.43
Based on DOWN max only (-14.8%): 17.26
Open to requests for other symbols.
#shortcalls
$AMZN BTC 3/15 1675 and STO 3/22 1690 call for additional 3.60 credit. Sold against long 4/18 1700 calls.
#earlyassignment
$EVTC Assigned 3/15 calls at 30. Basis 29.70 Stock current price 28.67
HIIQ Covered my naked calls that I did today.
HIIQ BTO STOCK @33.68
#dividends SPDR funds
I’m not certain but I think the SPDR ETFs are all ex-div tomorrow, symbols beginning with X, I’m open to correction if I’m wrong.
#Earnings Bpought to open $AVGO Mar 15th 260/265/267.5 call #BrokenWingButterfly for 1.70. No upside risk. Allows for a 3% downside move.
#SPX1dte Sold $SPX March 15th (PM) 2755/2775-2835/2855 condors for .75. (IV: 10.37%, SPX 2809)
I will be closing today’s condor for as cheaply as possible into the close, to avoid gap risk on tomorrow morning’s settlement.
HIIQ STO 3/15/19 32.0 PUTS @.45 I’ll accept the stock if put to me. Stock seems to be settling down.
#Earnings — Sold ADBE Mar 15th 245/250-280/285 condor for 1.12. Allows 5.7% move in either direction. Such a move has only been significantly exceeded twice in the data below.
$ADBE reports tonight. Below are details on earnings one-day moves over the last 12 quarters.
Dec. 13, 2018 AC -7.28% Biggest DOWN
Sept. 13, 2018 AC +2.29%
June 14, 2018 AC -2.43%
March 15, 2018 AC +3.05%
Dec. 14, 2017 AC +1.43%
Sept. 19, 2017 AC -4.24%
June 20, 2017 AC +2.36%
March 16, 2017 AC +3.80%
Dec. 15, 2016 AC -1.47%
Sept. 20, 2016 AC +7.11% Biggest UP
June 21, 2016 AC -5.72%
March 17, 2016 AC +3.84%
Avg (+ or -) 3.75%
Bias 0.23%, no significant bias on earnings.
With stock at 265.00 the data suggests these ranges:
Based on current IV (expected move into Friday per TOS): 252.53 to 277.47
Based on AVERAGE move over last 12 quarters: 255.06 to 274.94
Based on MAXIMUM move over last 12 Q’s (7.3%): 245.71 to 284.29
Open to requests for other symbols.
HIIQ STO 3/15/19 33.0 CALLS @1.10 Will cover at33.50
HIIQ STO 3/15/19 36.0 CALLS @.65 If it goes up, it will benefit my ITM short Puts.
#coveredcallcampaign NTGR
In early February I was assigned from a Dec. put that was sold in July as a #fallingknife. The cost basis was down to 36.95, sold an April 19, 36 call for 1.25.
#earnings AVGO
Sold April 18, 230/240/300/310 #ironcondor for 1.85, surprised to be filled. Break evens are outside past 1 day max moves. Thanks for the data Jeff.
#Earnings — Bought ORCL Mar15/Mar22 53 #DoubleCalendar for .23 & .24.
$ORCL reports tonight. Below are details on earnings one-day moves over the last 12 quarters.
Dec. 17, 2018 AC +0.26%
Sept. 17, 2018 AC -0.30%
June 19, 2018 AC -7.45%
March 19, 2018 AC -9.43% Biggest DOWN
Dec. 14, 2017 AC -3.76%
Sept. 14, 2017 AC -7.67%
June 21, 2017 AC +8.56% Biggest UP
March 15, 2017 AC +6.22%
Dec. 15, 2016 AC -4.30%
Sept. 15, 2016 AC -4.74%
June 16, 2016 AC +2.69%
March 15, 2016 AC +3.82%
Avg (+ or -) 4.93%
Bias -1.34%, negative bias on earnings.
With stock at 53.00 the data suggests these ranges:
Based on current IV (expected move into Friday per TOS): 50.52 to 55.48
Based on AVERAGE move over last 12 quarters: 50.39 to 55.61
Based on MAXIMUM move over last 12 Q’s (9.4%): 48.00 to 58.00
Based on Max UP only (+8.6%): 57.54
Open to requests for other symbols.
HIIQ STO 3/15/19 36.0 CALLS @.65 Stock got killed yesterday. Me too! Short puts. Short calls helped.
#Earnings — $AVGO reports tonight. Below are details on earnings one-day moves over the last 12 quarters.
Dec. 6, 2018 AC +0.58%
Sept. 6, 2018 AC +7.69%
June 7, 2018 AC -2.53%
March 15, 2018 AC -4.81% Biggest DOWN
Dec. 6, 2017 AC 0.00%
Aug. 24, 2017 AC -3.70%
June 1, 2017 AC +8.49% Biggest UP
March 1, 2017 AC +0.99%
Dec. 8, 2016 AC +4.90%
Sept. 1, 2016 AC -2.24%
June 2, 2016 AC +4.93%
March 3, 2016 AC +6.35%
Avg (+ or -) 3.93%
Bias 1.72%, positive bias on earnings.
With stock at 271.00 the data suggests these ranges:
Based on current IV (expected move into Friday per TOS): 257.74 to 284.26
Based on AVERAGE move over last 12 quarters: 260.34 to 281.66
Based on MAXIMUM move over last 12 Q’s (8.5%): 247.99 to 294.01
Based on Max DOWN only (-4.8%): 257.96
Open to requests for other symbols.
#coveredcalls
$ETSY BTC 3/15 65 call and STO 4/18 70 call. Total credit received so far 1.05. Basis 50.25
#longleaps
$TQQQ BTC 3/15 53 call and STO 3/22 53 for additional .65 credit
#spx1dte
$SPX 2730/2760/2824/2845 STO at .80
#CoveredCalls – BA news gave the market just enough of a pullback to fill these. Trying to squeeze a little more out of these so rolling out but not up keeping some downside protection.
Rolled TNA MAR 15 2019 60.0 Calls to TNA Apr 05 2019 60.0 Calls @ 1.35 credit
Rolled TQQQ MAR 15 2019 50.0 Calls to APR 05 2019 50.0 Calls @ 1.00 credit
#ShortPuts #FallingKnife – Starter position just before next earnings…
Sold 1 ROKU APR 26 2019 50 Put @ 1.35
#SPX1dte Sold $SPX March 14th (monthlys) 2750/2770-2855/2875 condors for 1.00.(IV 13%, SPX: 2816)
#earnings AVGO
Jeff I almost missed fan favorite AVGO reports tomorrow, do you have data? Thanks
NTNX BTO STOCK @38.42
I am long $TQQQ 66.67 LEAP calls for Jan 2020. I wanted to look at the effect of compounding on the TQQQ, which moves 3x the $QQQ on a daily basis. Levered ETF’s like this are naturally drawn toward zero, a topic I’ve covered before as #ContangoETFs. This is why some of us sell calls on $DUST and $NUGT and a few others like $BOIL. Even though they can go high pretty fast, they will always be drawn back toward zero.
Here’s a chart from my long-ago webinar demonstrating the effect, using hypothetical 10% moves, up and down, on $GDX, and its levered ETFs NUGT and DUST:
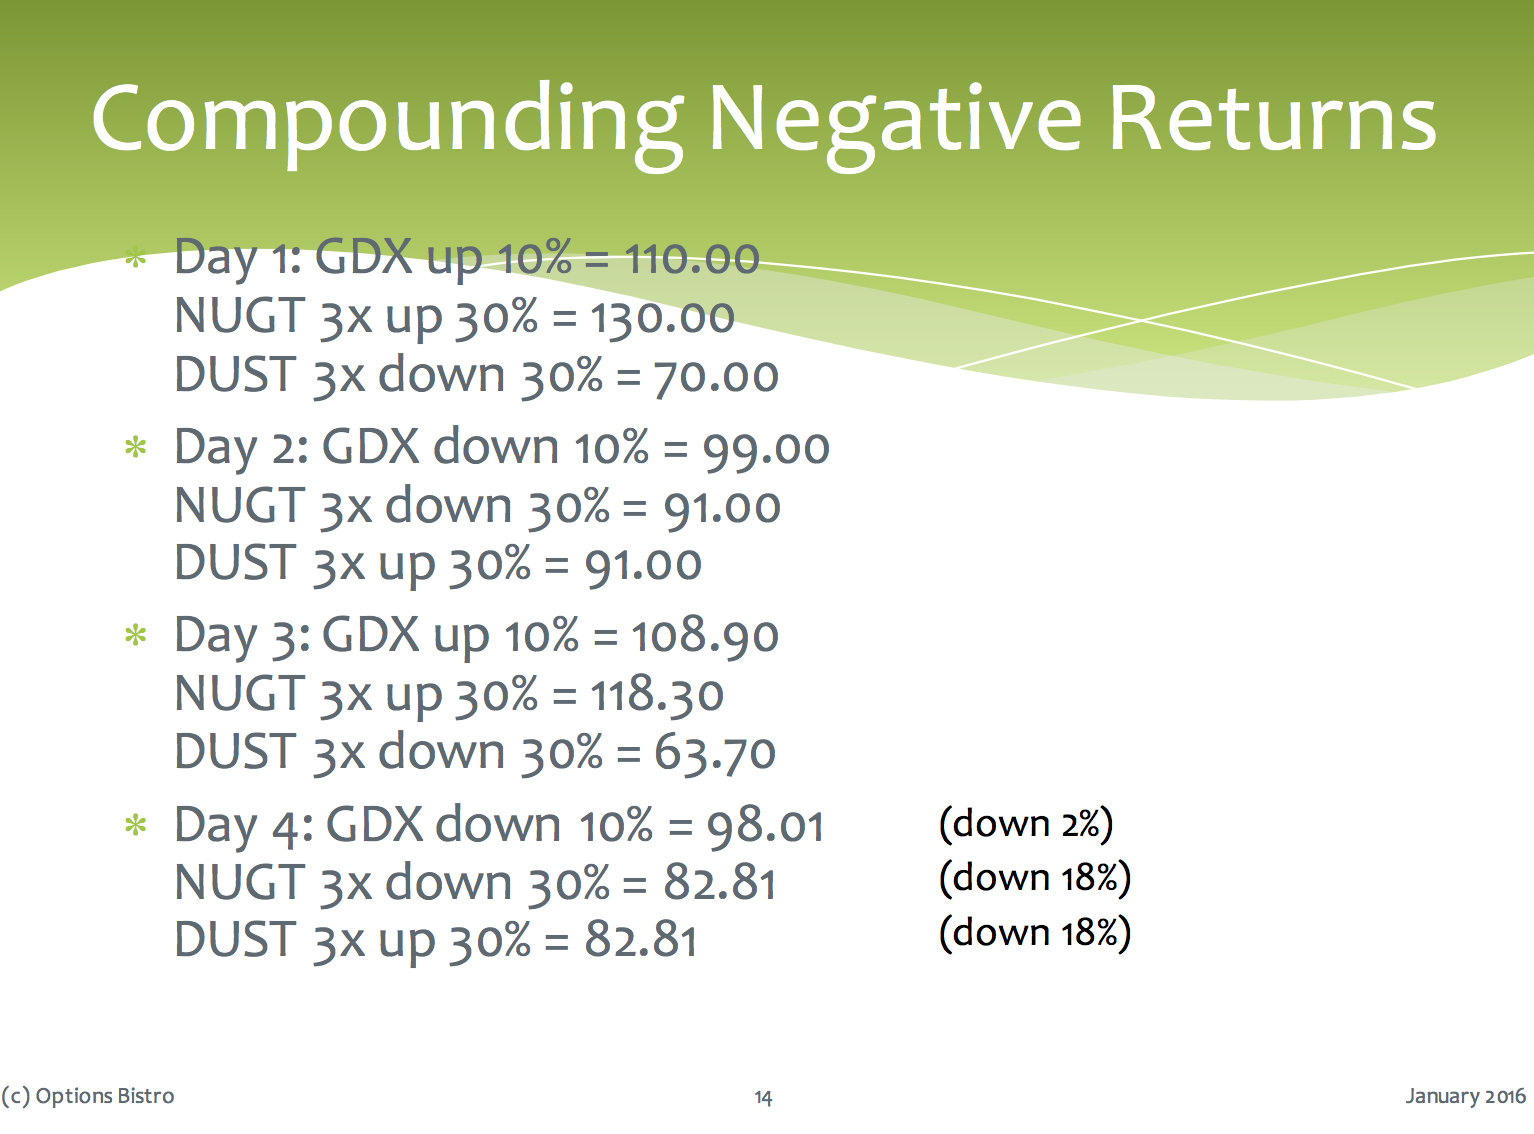
As you can see, over just 4 days of moving up and down, GDX is only down 2% and both ETF’s are down 18%. Note that even though NUGT is bullish and DUST is bearish, they moved down the exact same amount.
So I was thinking of TQQQ over the last several months, since the market has gone up and down significantly. Unlike the gold miners, the indices like QQQ have been steadily rising for years, so can we can expect better behavior? I found that the close on June 6, 2018, was only 17 cents off from yesterday’s close on QQQ, so basically the same, and the perfect point from which to measure.
First, I looked at the intraday high of the year, on Aug 30th.
$QQQ up 6.6% from June 6 (175.86 to 187.52)
$TQQQ up 19.1% from June 6 (61.61 to 73.36) *better
This is not surprising, as the move was straight up, and TQQQ performs x3 the QQQ.
Then I looked at yesterday’s close:
QQQ flat at 175.69 from June 6th
TQQQ down 11.7% from June 6th *worse
So, from June 6 until now, TQQQ has suffered from the 3x compounding, while QQQ ended flat.
Looking at a longer time-frame, from the summer highs of 2015:
QQQ up 49.6%
TQQQ up 129.0% *better
What do we conclude? If an underlying has a persistent bullish trend, as QQQ and all the major indices have had since 2009, the triple levered ETF’s will perform better. However, if we enter a period of consolidation, or a bear trend, they will perform more weakly than the underlying.
Sold to close $VXXB Mar 15 33.50/28.50 bear put spreads for 3.86. Bought for 2.38 on 2/21.
Bought to close $UVXY Apr 18 56/66 bear call spreads for .51. Sold for 1.61 on 3/8.
#SPX1dte Bought to close $SPX March 13th 2825 calls for .90. Condors sold yesterday for .80. Will be placing a new one today with monthlys that stop trading at tomorrow’s close.
#shortputs CVS
March 7, sold April 18, 50 put for .86, bought today for .22, thanks Ramie
#Earnings — $DG reports tomorrow morning. Below are details on earnings one-day moves over the last 12 quarters.
Dec. 4, 2018 BO -6.80%
Aug. 30, 2018 BO -0.97%
May 31, 2018 BO -9.36%
March 15, 2018 BO +4.75%
Dec. 7, 2017 BO +2.77%
Aug. 31, 2017 BO -5.43%
June 1, 2017 BO +6.54%
March 16, 2017 BO +0.53%
Dec. 1, 2016 BO -4.96%
Aug. 25, 2016 BO -17.62%
May 26, 2016 BO +4.61%
March 10, 2016 BO +10.66%
Avg (+ or -) 6.25%
Bias -1.27%, negative bias on earnings.
With stock at 121.00 the data suggests these ranges:
Based on current IV (expected move into Friday per TOS): 114.40 to 127.60
Based on AVERAGE move over last 12 quarters: 113.44 to 128.56
Based on MAXIMUM move over last 12 Q’s (17.6%): 99.68 to 142.32
Based on Max UP only (+10.7%): 133.90
Open to requests for other symbols.
#Earnings #Assignment #EarlyAssignment #ShortStock
Assigned over half of my position on $SFIX short 25 calls. Closed short stock position for 31.90. Will sell long calls to cancel out loss, and hopefully cancel out original purchase too if I can get the stock just a bit higher.
#ShortPuts – Taking these off a little early as a precaution…
Bought to Close NTES APR 18 2019 190.0 Put @ .25 (sold for 2.90)
Bought to Close NVDA MAR 22 2019 145.0 Put @ .22 (sold for 2.95)
#SPX1dte BTC $SPX March 22nd 2825/2850 call spreads for 10.50. Condors sold for 6.00 on Monday. Had no choice but to close in face of renewed upside warning and strong rally. I’m letting the 2720/2700 put side decay some more, and also added a Partial #ReverseRoll:
Sold SPX March 22nd 2780/2755 put spreads for 3.45.
Now in the hole and will have to choose when to sell a new call spread. Also may need to close today’s 1-dte with short at 2825. Hard to believe it could reach that but after Monday’s 40-point rise we can’t be sure.
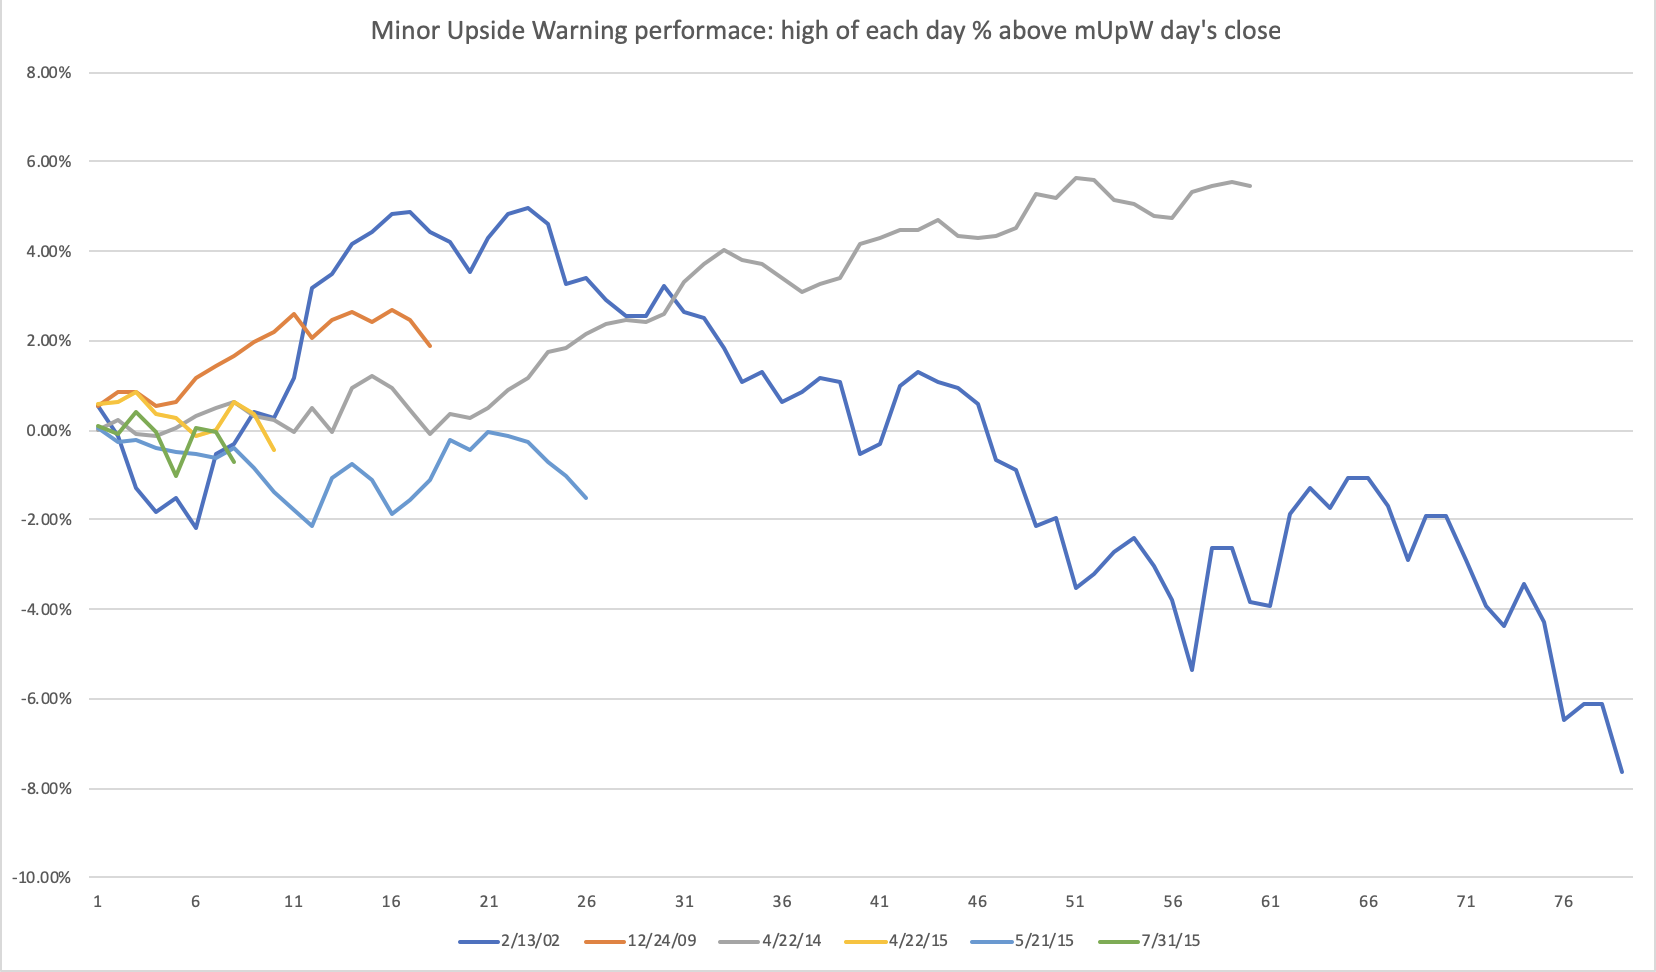
#VIXIndicator Usually the Upside Warning is canceled when we get a Downside Warning. But sometimes, like last Monday, the UpW is canceled by an intraday spike on the $VIX, with no DW taking effect. Usually when that happens, the DW comes within the next few days.
But sometimes, the VIX retreats enough to fire a “minor” upside warning… which is measured on the Fib levels from the recent intraday spike. So three closes below the 78.6% line would fire this “minor” signal.
That will happen today provided VIX closes below 14.44.
This has happened only 6 times since 2000. Below is a chart with the performance of SPX in the days after each “mUpW”, ending at the next VIX spike or DW. You can see that it is mostly positive; even the longest one that goes negative spiked pretty high before rolling over.
#ShortCalls – Approaching it’s all time low again reached at the beginning of October just prior to the spike to 95…LOL
Bought to Close UVXY MAR 15 2019 52.5 Calls @ .02 (sold for 1.42)
HIIQ STO 3/15/19 38.0 PUTS @.80 Expires in 2 days & 5.5 hrs. ;>)
SFIX STO 3/15/18 33.0 CALLS @.70 NTM
#coveredcalls
$LABU BTC 3/15 57 calls and STO 3/22 62 calls at breakeven on calls. Gain possible $5 if assigned.
#SPX1dte Sold $SPX March 13th 2740/2760-2825/2845 condors for .80 (IV: 10.46%, SPX: 2792)
#shortputs
$HIIQ BTC 3/15 40 Puts and STO 4/18 40 Puts for additional 2.16 credit
Bought to close $AAPL Jun 21 130 puts @ .27. Sold for 1.30 on 11/13.
#ShortPuts – The gift that keeps on giving…
Bought to Close NVDA MAR 15 2019 145.0 Put @ .05 (sold for 2.46)
#shortputspread
$NFLX BTC 3/15 345/335 BUPS at .60 STO on 2/15 for 3.00 I have a 335/325 BUPS remaining.
$ADBE BTC 3/15 255/270 BUPS at 6.51 STO on 2/27 at 7.40.
BTO Mar 22 154/152 Puts $.75 #hedge
BTO Mar 22 155/157.50 Calls $1.70 #supercharger
BTO Mar 15 177.5/180 Calls 1.85 #supercharger
SFIX STO 3/15/19 35.0 CALLS @1.10 Will cover stock if necessary. 3.5 days to expiration,
SFIX STO 3/15/19 36.0 CALLS @.61 Up big on earnings.
TRADES: NTNX Moved into the gap since its big drop.
NTNX BTO STOCK @35.76, 36.40, 37.10 A position and a half.
HIIQ STO 3/15/19 39.0 PUTS @1.30 Want to own the stock a little cheaper.
PYX STO 3/15/19 30.0 CALLS @1.00
I have an order in to unwind the double calendar but there is no fill yet. Just no liquidity today. This was just a test trade for me so not any real risk on this trade.
#longleaps
$TQQQ Rolled out and up BTC 3/15 52 call and STO 4/18 55 call for additional .70 credit
#coveredcalls
$BEAT STO 3/15 70 call at .70
$FB STO 3/15 177.50 call at .54
#spxcampaign
Following @jeffcp66
$SPX STO 3/22 2710/2685/2820/2845 at 6.40
#shortputspread
$EA BTC 3/15 75/85 BUPS at .50 STO on 3/15 for 1.64
PYX STO 3/15/19 25.0 PUTS @2.16
#shortputspread
$AMZN BTC 3/15 1500/1550 BUPS at .50. STO 1/4 for 10.00 Thank you @ramie77
#earnings MOMO
Jeff do have data on MOMO? Thanks
#LongLEAPs #SyntheticCoveredCalls Sold $TQQQ March 22nd 52 calls for 1.25 (earlier)
#SPX1dte The is the kind of hit this strategy cannot suffer often. Bought to close $SPX March 11th 2770 calls for 6.10. I was working to close for the last 20 minutes but could not get a pullback. I will make a few cents back sell the long 2790’s, but only .20-.30 cents (first ones just filled for .20).
I’m going to maintain a view of weakness and sell an aggressive call spread to work on the roll.
I set my sights to close after we breached 2760. Wasn’t too concerned until by shorts hit 3.00. Then, the rally would not relent. This was the Monday I was looking for last week, when I was LONG calls. I almost made the same trade on Friday but decided to go short. Then, the rally into the close set me up for this painful Monday.
#CoveredCalls – Going out just one month. This will capture the divvy and then allow another sale in earnings the following week.
Bought to Close T MAR 15 2019 31.0 Calls @ .02 (sold for .41)
Sold T APR 18 2019 31.0 Calls @ .23
#Earnings — This is another cheap shot with a fairly new stock that’s been volatile. Profit range allows 20% in either direction. If this drifts toward the center during the week it could be a triple or quadruple.
Bought $SFIX Mar15/Mar22 25 #DoubleCalendar for .20, .24, .25.
$SFIX reports tonight. Below are details on earnings one-day moves over its entire history.
Dec. 10, 2018 AC -20.90%
Oct. 1, 2018 AC -35.15% Biggest DOWN
June 7, 2018 AC +26.48% Biggest UP
March 12, 2018 AC -3.60%
Dec. 19, 2017 AC -9.77%
Avg (+ or -) 19.18%
Bias -8.59%, negative bias on earnings.
With stock at 25.00 the data suggests these ranges:
Based on current IV (expected move into Friday per TOS): 20.06 to 29.94
Based on AVERAGE move over last 12 quarters: 20.21 to 29.80
Based on MAXIMUM move over last 12 Q’s (35.2%): 16.21 to 33.79
Based on Max UP only (+26.5%): 31.62
Open to requests for other symbols.
#CoveredCalls – Rolling a few days early to avoid possible exercise (and I won’t have much market access Thur-Fri). For some reason this ticker likes the early exercise…
Rolled TNA MAR 15 2019 52.0 Calls to MAY 17 2019 54.0 Calls @ .72 credit
#SPX1dte Closed $SPX March 11th 2690 short puts for .05. Will work to close 2770 short calls as stop was breached.
#ShortPuts – Staying prior to next earnings. Look to roll into the high IV or sell covered call then if needed.
Sold BA APR 18 2019 325.0 Put @ 3.50
STO January 2020, 300 puts @ 14.00
#shortputs
$NTNX STO 3/15 35 put at 1.00 Thank you @honkhonk81
$HIIQ STO 3/15 39 put at 2.30 I am being goosed along by @honkhonk81. Thank you my feathered friend.
#assignment
$BURL Assigned shares at 165 and 167.5 via a bullish trade on earnings. Stock currently at 143.52. Plan to sell calls if stock stabilizes. Right now it looks to be made of lead.
#rolling
$SOXL BTC 5/17 100 call and STO 5/17 125 call at even. Stock currently at 117
#LongStock #ShortPuts – Stock will be called away @ 150.0 (basis 141.90)
Trying to replace it adding to previous put sales…
Sold NVDA MAR 22 2019 145.0 Put @ 2.95
Sold $UVXY Apr 18 56/66 bear call spread for 1.61 with UVXY at 47.99
Closed 3/8 2700/2720/s850/2830 at .50. STO at 1.95. Thank you @jeffcp66
#SPX1dte Sold to Open $SPX March 11th 2670/2690-2770/2790 for .90. (IV: 9.6%, SPX 2731)
BTC Mar8 BuPS 2700/2695 @.05 x8. STO @ .3125 x8 (average price)
BTC Mar8 BeCS 2790/2795 expired. STO @ .25 x4
Total profit $300
#spx1dte


Link to calendar: https://us.econoday.com/byweek.asp?day=11&month=3&year=2019&cust=us&lid=0
Borrowing an idea from TastyTrade (from yesterday). Better premium today.
Sold $AMZN Apr 18 1470/1480/1780/1790 iron condor for 2.85. Leaning just a bit bullish with the down move (short puts at 19 delta/short calls at 15 delta).
HIIQ STO 3/15/19 40.0 CALLS @1.10
HIIQ STO 3/15/19 39.0 PUTS @2.05
NTNX STO 3/15/19 35.0 PUTS @.87
I’m optimistic about these stocks, that’s why I’m NTM on these trades.
#SPX1dte Closed $SPX March 8th 2700/2680 put spreads for .15. Condors sold yesterday for 1.10. I’ll let calls expire.
NTNX BTO STOCK @34.99
#SPX1dte BTC $SPX March 15th 2800/2820 call spreads for 1.15. Sold yesterday for 3.20 as a roll.
